Synthetix (SNXUSD) Trammeled in a Parallel Channel
Estimated Reading Time: 2 minutes
Don’t invest unless you’re prepared to lose all the money you invest. This is a high-risk investment and you are unlikely to be protected if something goes wrong. Take 2 minutes to learn more
SNXUSD Key Zones
Demand Zones: 29.00, 27.00, 23.60
Supply Zones: 19.40, 15.30, 14.00
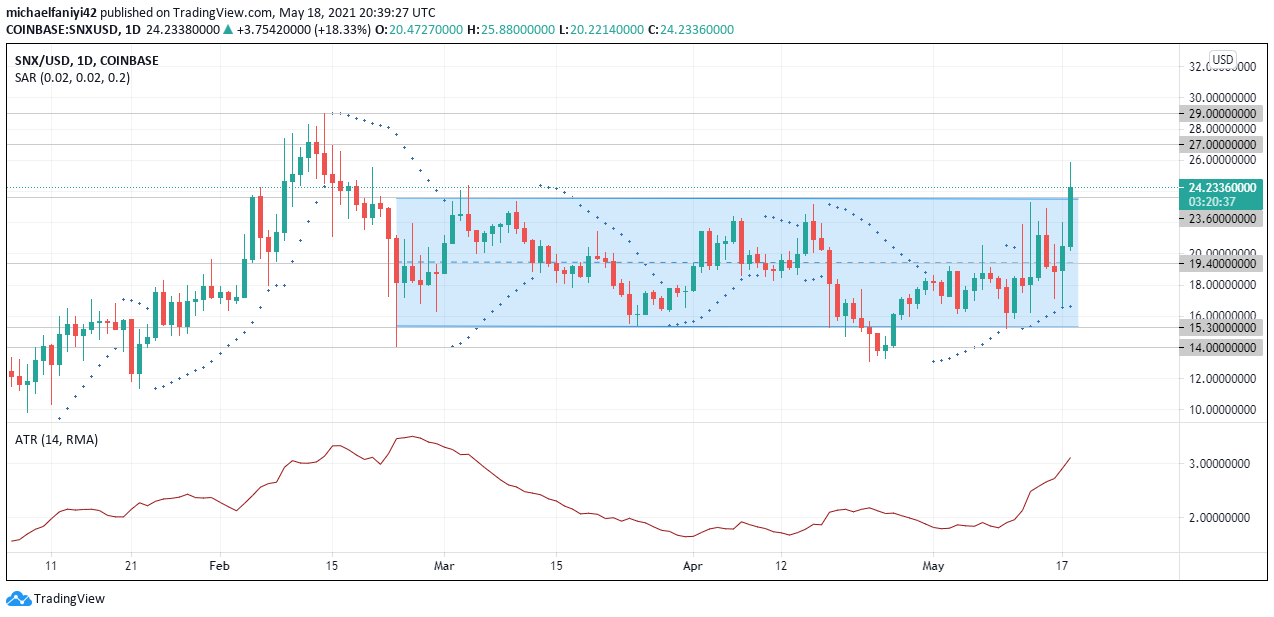
Since its inception about a week before Christmas on the 15th of December 2020, Synthetix has been with the bulls, and it has ever been on the rise. This continued with only a few major drawbacks till it hit its all-time high at 29.00 on Valentine’s Day 2021. The bears then took over the market, however, not for long as the price bearishness was halted at 14.00 resistance. SNX has since been trapped in a parallel channel between 23.60 resistance and 15.30 support, with 19.40 mid-level acting as support/resistance.
At the time of writing, the price has shown a strong bullish candle which has broken past the upper border of the parallel channel at 23.60 resistance. The Parabolic SAR (Stop and Reverse) has its dots under the candle to confirm the current bullish nature of the market.
The ATR (Average True Range) indicator helps us see that Synthetix has been increasingly volatile since last week from the 11th of May 2020. The signal line has been upwardly steep and is currently at 3.111. The volatility of the market is what helped it break out of the parallel channel, but this is likely a false break out and the price is expected to return to its down-and-up pattern within the parallel channel.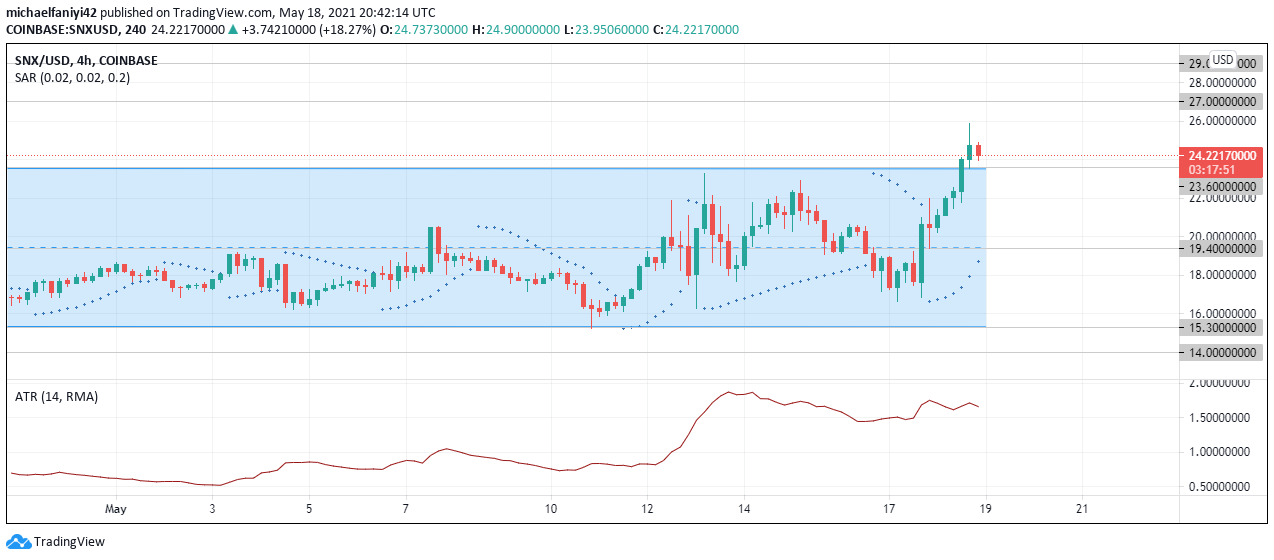
A bearish candle has been formed on the four-hour time frame as at the time of writing. The parabolic SAR is still reflecting price bullishness and the ATR indicator has since shown a slightly reduced volatility.
SNXUSD is expected to return to its pattern in the parallel channel and considering the volatility of the market, break past the mid-level and go further to the 15.30 support before the end of the week. But if volatility gets higher, the price could retest the upper border and shoot up to the 27.00 zone.
Note: cryptosignals.org is not a financial advisor. Do your research before investing your funds in any financial asset or presented product or event. We are not responsible for your investing results.