Binance Coin Fluctuates in an Overbought Region, May Face Rejection
Estimated Reading Time: 2 minutes
Don’t invest unless you’re prepared to lose all the money you invest. This is a high-risk investment and you are unlikely to be protected if something goes wrong. Take 2 minutes to learn more

Binance Coin (BNB) Long-Term Analysis: Bullish
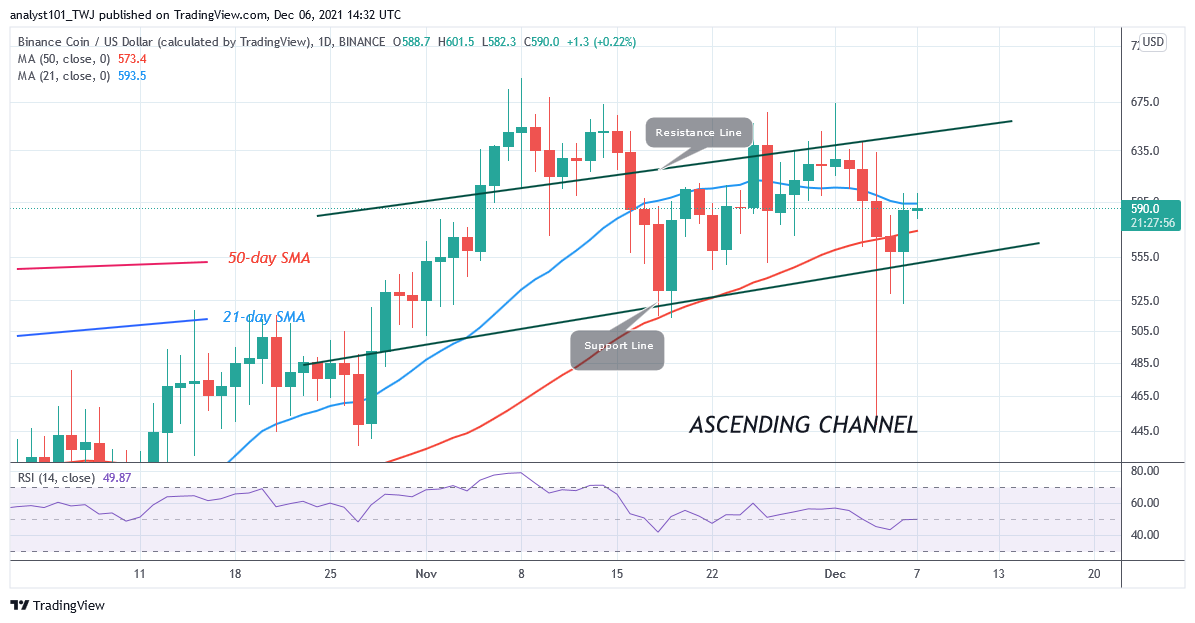
Binance Coin’s (BNB) price has resumed an upward move despite the December 4 price breakdown. On December 4 bearish impulses, BNB/USD dropped sharply to the low of $448.20 as bulls bought the dips. The cryptocurrency pulled back above $585 before resuming upward. BNB price has broken above the 50-day moving average line but it is below the 21-day moving average line. The altcoin is testing an overbought region of the market. There will be a possible decline.
Binance Coin (BNB) Indicator Analysis
BNB has fallen to level 49 of the Relative Strength Index for period 14. It indicates that there is a balance between supply and demand. The crypto’s price is in between the moving averages. This will cause the altcoin to fluctuate. BNB is above the 80% range of the daily stochastic. The crypto is in the overbought region. The market may decline.
Technical indicators:
Major Resistance Levels – $640, $660, $680
Major Support Levels – $540, $520, $500
Technical indicators:
Major Resistance Levels – $640, $660, $680
Major Support Levels – $540, $520, $500
What Is the Next Direction for Binance Coin (BNB)?
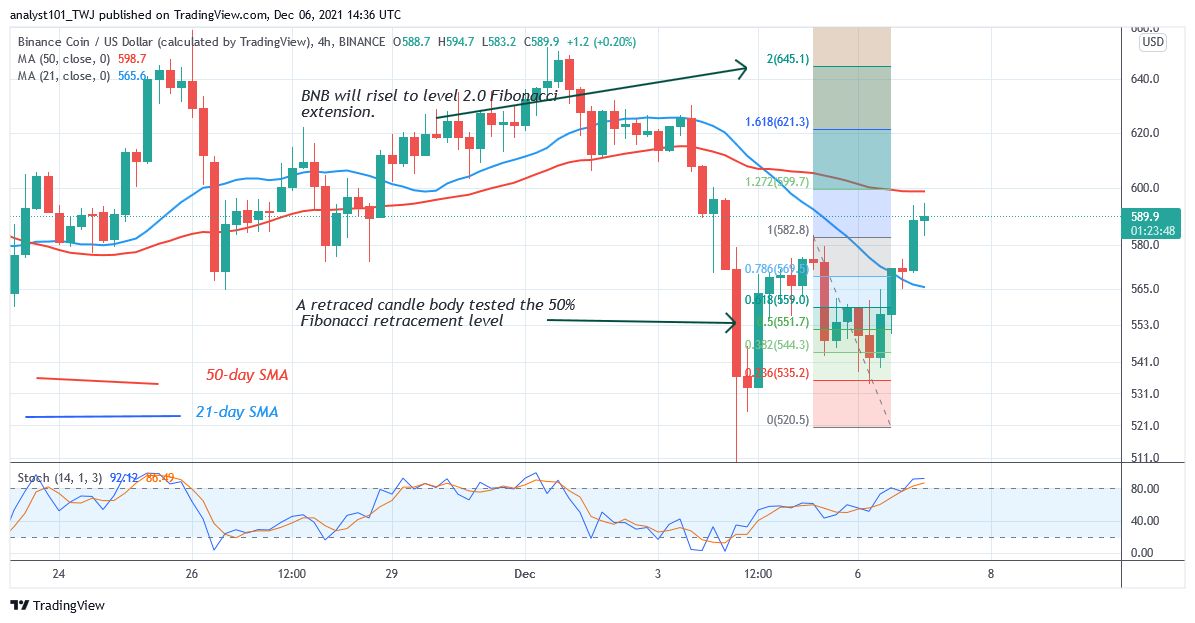
On the 4 –hour chart, BNB/USD is in an upward move but it is likely to face resistance. If price breaks the resistance level, the Fibonacci tool analysis will hold. Meanwhile, on December 5 uptrend; a retraced candle body tested the 50% Fibonacci retracement level. The retracement indicates that Binance Coin will rise to level 2.0 Fibonacci extension or $645.10.
You can purchase crypto coins here. Buy Tokens
Note: Cryptosignals.org is not a financial advisor. Do your research before investing your funds in any financial asset or presented product or event. We are not responsible for your investing results