Binance Coin Makes a Sharp Rise As Buyers Step In
Estimated Reading Time: 2 minutes
Don’t invest unless you’re prepared to lose all the money you invest. This is a high-risk investment and you are unlikely to be protected if something goes wrong. Take 2 minutes to learn more
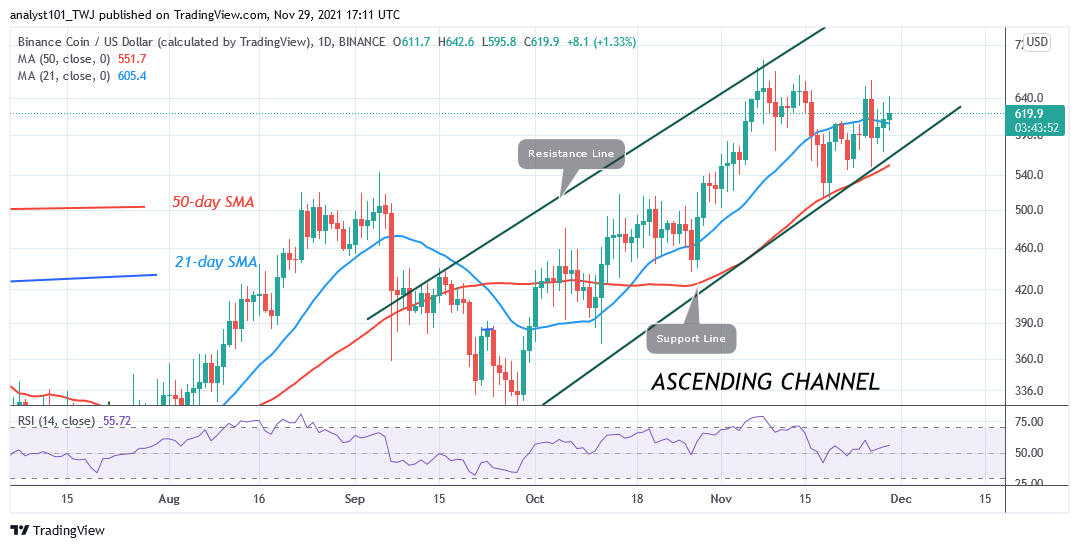

Binance Coin (BNB) Long-Term Analysis: Bullish
Binance Coin (BNB) price has resumed upward move. BNB price has broken above the moving averages. If the current bullish momentum is sustained, the uptrend will resume. Buyers will push the crypto to retest the $660 price level. The upward move is facing resistance at the high of $640. BNB will test the resistance and pulled back. The long wicks are indicating that the $640 and $660 highs are strong selling pressure.In May, buyers pushed BNB to the high of $680 but could not keep BNB price above it. The cryptocurrency dropped sharply from the recent high.
Binance Coin (BNB) Indicator Analysis
BNB has fallen to level 48 of the Relative Strength Index for period 14. It indicates that the altcoin is in the downtrend zone and capable of a further downward move. The crypto’s prices are in between the moving averages. BNB is above the 25% range of the daily stochastic. The stochastic bands are sloping horizontally.
Technical indicators:
Major Resistance Levels – $640, $660, $680
Major Support Levels – $540, $520, $500
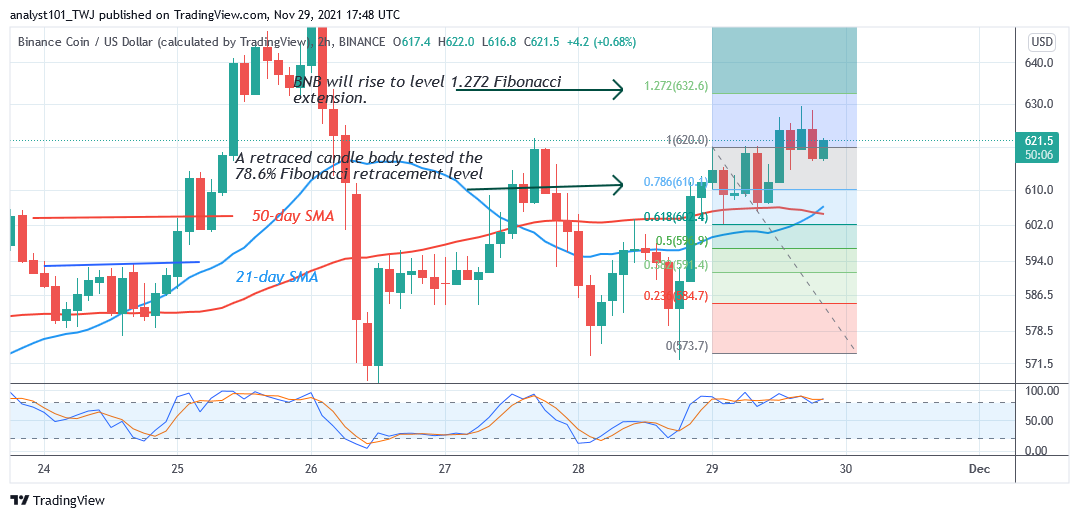
What Is the Next Direction for Binance Coin (BNB)?
On the 4 –hour chart, BNB/USD is in a downward move. The crypto is confined between the two moving averages. Meanwhile, on November 11 downtrend; a retraced candle body tested the 50% Fibonacci retracement level. The retracement indicates that Binance Coin will fall to level 2.0 Fibonacci extension or $453.70.
You can purchase crypto coins here. Buy Tokens
Note: Cryptosignals.org is not a financial advisor. Do your research before investing your funds in any financial asset or presented product or event. We are not responsible for your investing results