Binance Coin Approaches the Oversold Region as Sellers Threaten To Short
Estimated Reading Time: 2 minutes
Don’t invest unless you’re prepared to lose all the money you invest. This is a high-risk investment and you are unlikely to be protected if something goes wrong. Take 2 minutes to learn more
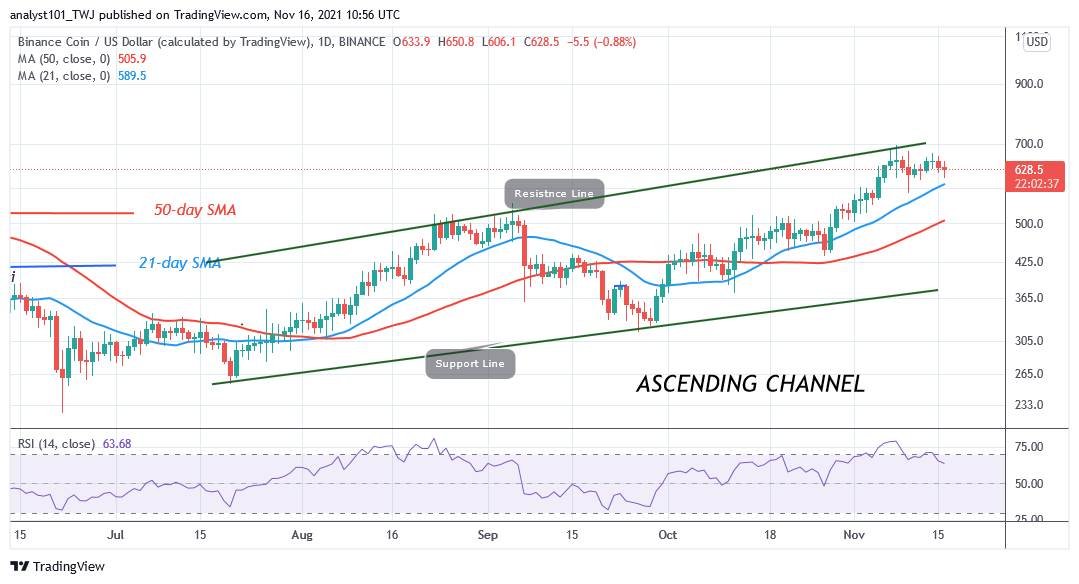

Binance Coin (BNB) Long-Term Analysis: Bullish
Binance Coin (BNB) is in an upward move but the uptrend has been stalled at the high of $660 price level. Since November 7, BNB price has been compelled to a sideways move. The bulls have retested the resistance level on four occasions but failed to keep the BNB price above it. Incidentally, these are the historical price levels between May 3 and May 12. Today, the bulls are retesting the resistance zone to break above it. In the previous price action in May, BNB price was resisted and the altcoin plunged to $225 low.
Binance Coin (BNB) Indicator Analysis
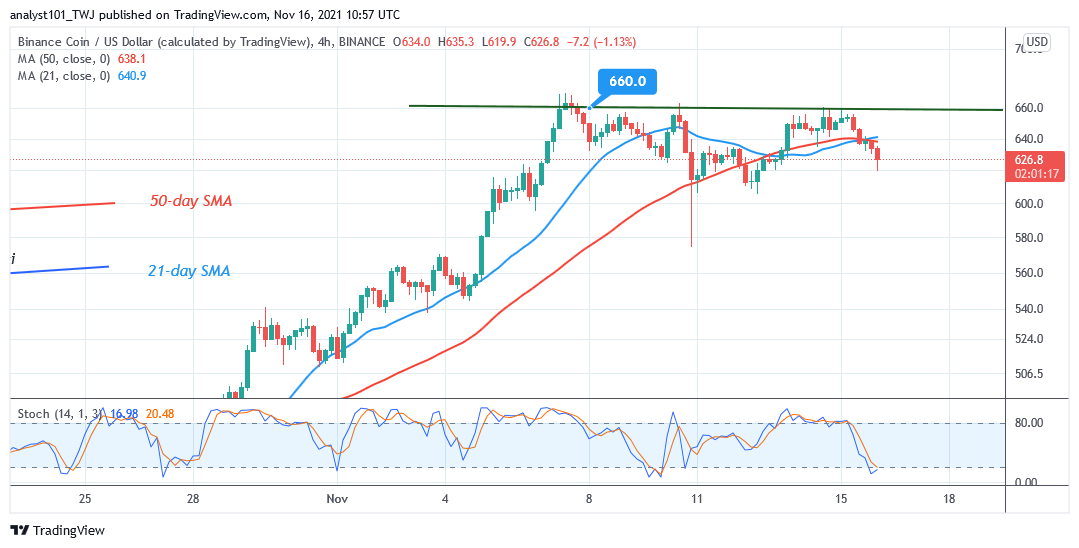
BNB has fallen to level 62 of the Relative Strength Index for period 14. It indicates that the cryptocurrency is in the bullish trend zone and capable of a further upward move. The crypto’s prices are above the moving averages which indicate further upsides. BNB is below the 20% range of the daily stochastic. It indicates that the cryptocurrency has fallen into the oversold region of the market. The current downtrend is reaching bearish exhaustion. Buyers are expected to emerge in the oversold region. The uptrend will resume if price breaks above the resistance at $660. BNB will attain another high of $710.
Technical indicators:
Major Resistance Levels – $640, $660, $680
Major Support Levels – $540, $520, $500
What Is the Next Direction for Binance Coin (BNB)?
On the 4 –hour chart, BNB/USD is in a sideways trend. Yesterday, the bulls retested the resistance level and were repelled. The crypto is falling on the downside. In previous price rejection, the market will decline to $613 support.
You can purchase crypto coins here. Buy Tokens
Note: Cryptosignals.org is not a financial advisor. Do your research before investing your funds in any financial asset or presented product or event. We are not responsible for your investing results.