Litecoin (LTC/USD) Price Elongates in a Range-Trading Spot
Estimated Reading Time: 3 minutes
Don’t invest unless you’re prepared to lose all the money you invest. This is a high-risk investment and you are unlikely to be protected if something goes wrong. Take 2 minutes to learn more

Free Crypto Signals Channel
Litecoin Price Prediction – June 7
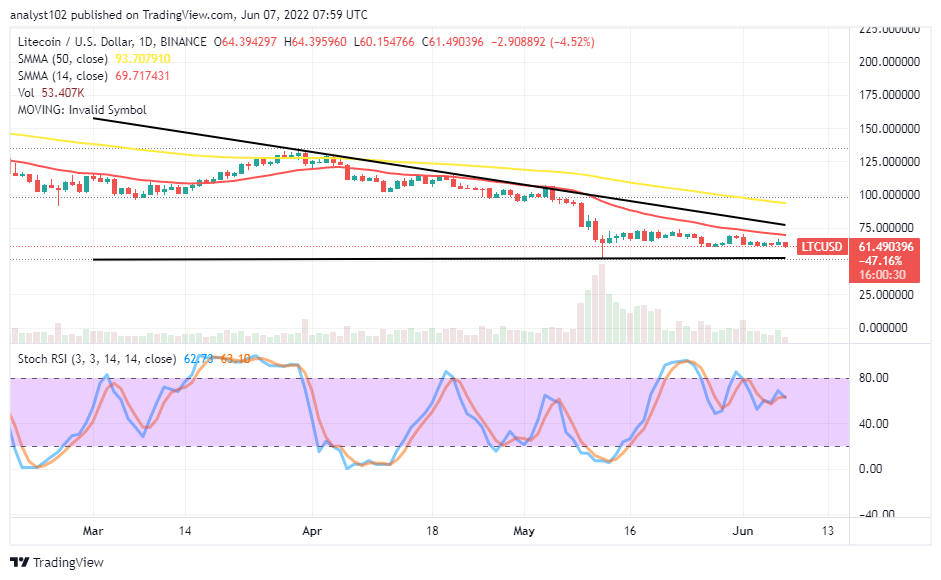
The LTC/USD valuation price elongates in a range-trading spot following its inability to spring northward from a significant declining motion that dominated most crypto economies. The market is trading around $61, keeping a negative percentage rate of 4.52.
LTC/USD Market
Key Levels:
Resistance levels: $75, $100, $125
Support levels: $50, $35, $20
LTC/USD – Daily Chart
The LTC/USD daily chart reveals price elongates in a range-trading spot not different from the zone it started over time until the present. The 14-day SMA indicator is slightly southward, trending over the formation of variant lows beneath the trend line of the 50-day SMA. The bearish trend line closely drew over the smaller-trading indicator to make a markdown at the $75 resistance level. The Stochastic Oscillators are seemingly consolidating in wide ranges of 80 and 40.
Can there be a further loss of momentums beyond the $50 LTC/USD market support level?
There can be a further loss of momentums beyond the $50 LTC/USD market support level to allow buyers to get repositioned for a rebound that can trail a volatile motion in the process afterward as price presently elongates in a range-trading spot beneath the SMAs. Long-position takers would still have to exercise a degree of cautiousness regarding their launching of orders. On the contrary, investors may consider introducing some of their capital into the crypto business now.
On the downside of the technical analysis, the LTC/USD short-position takers may watch out for a pull-up to purposely touch a point around the upper range-resistant trading at $75 to observe if there’ll be an active reversal motion before the execution of a selling order. Smaller time frames such as 1-hour and 4-hour will be instrumental in detecting a timely entry.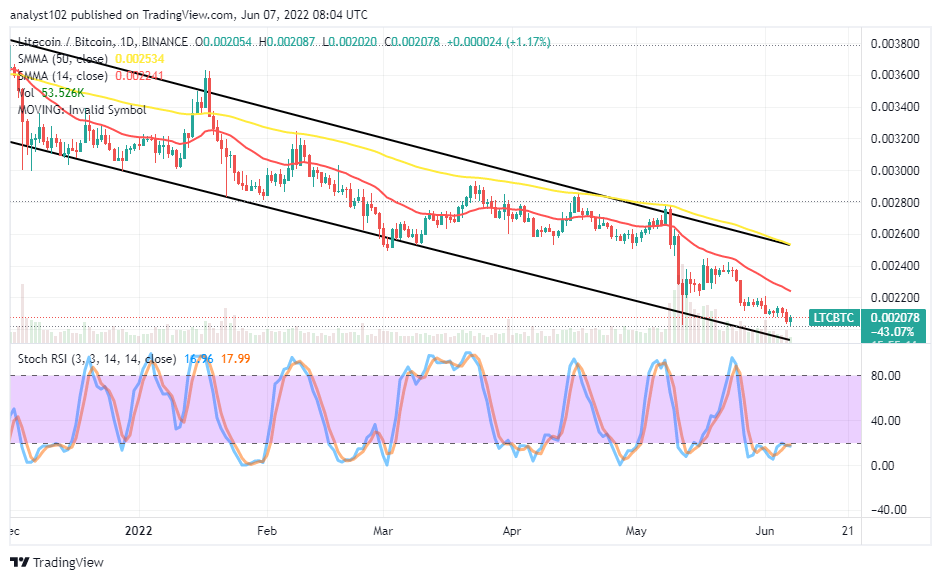
LTC/BTC Price Analysis
Litecoin’s trending ability against Bitcoin has been under an intense downward-trending motion. Another technical viewing expression states the cryptocurrency pair price elongates in a downward-trading trend below the SMAs. The 50-day SMA indicator is above the 14-day SMA indicator. The Stochastic Oscillators are in the oversold region, oscillating around the 20 range. That signifies the base crypto is struggling to regain a part of its lost trending points against the flagship countering crypto.
Note: Cryptosignals.org is not a financial advisor. Do your research before investing your funds in any financial asset or presented product or event. We are not responsible for your investing results.
“Lucky is up more than 50% today but still more than 430% from All Time Highs!
The opportunity to bank BIG is now!
You can purchase Lucky Block here. Buy LBlock