Polkadot (DOT) Declines and Pulls Back Above $25, May Resume Selling Pressure.
Estimated Reading Time: 2 minutes
Don’t invest unless you’re prepared to lose all the money you invest. This is a high-risk investment and you are unlikely to be protected if something goes wrong. Take 2 minutes to learn more
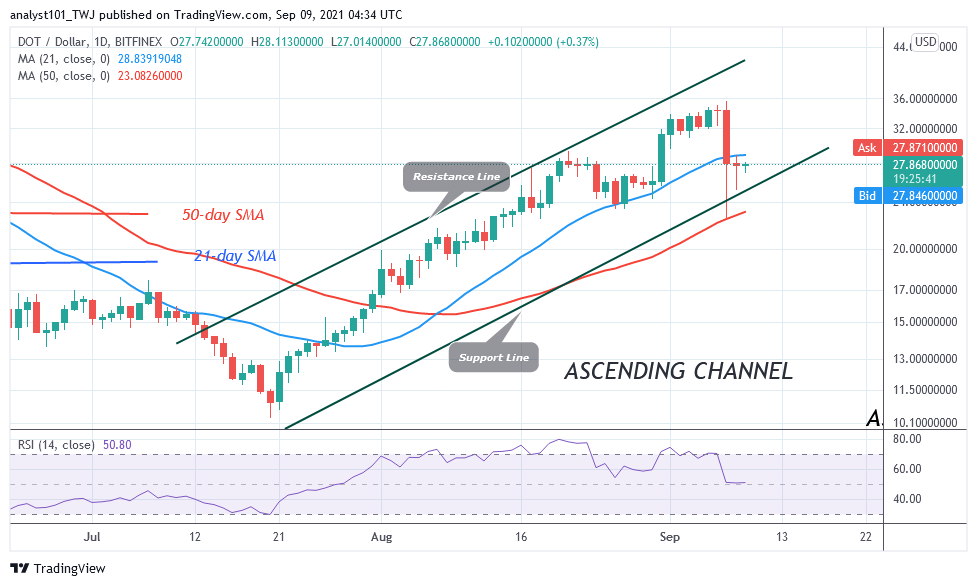
Polkadot (DOT) Long-Term Analysis: Bearish
Polkadot’s (DOT) price has resumed a downward move after attaining the high of $35.66. The altcoin dropped sharply to reach the low of $22.50 as bulls bought the dips. The crypto pulled back above the $25 support and resumed consolidation above the current support. For the past few days, DOT/USD is now fluctuating between $25 and $29.50 price levels. The altcoin will resume trending if any of the range-bound levels are broken. For instance, the selling pressure will continue, if the bears break below the previous low of $22.50. On the upside, if the price breaks above the $29.50 resistance and the bullish momentum is sustained, the uptrend will resume. In the meantime, DOT prices is fluctuating within a confined range.
Polkadot (DOT) Indicator Analysis
Polkadot has fallen to level 49 of the Relative Strength Index period 14. It indicates that there is a balance between supply and demand. DOT price is falling as it broke below the 21-day SMA and approaches the 50-day SMA. A break below the SMAs will mean the resumption of a downtrend. Also, the DOT price is above the 30% range of the daily stochastic. It indicates that the market is in a bullish momentum which is contrary to the current trend.
Technical indicators:
Major Resistance Levels – $48, $52, $56
Major Support Levels – $32, $28, $24
What Is the Next Direction for Polkadot (DOT)?
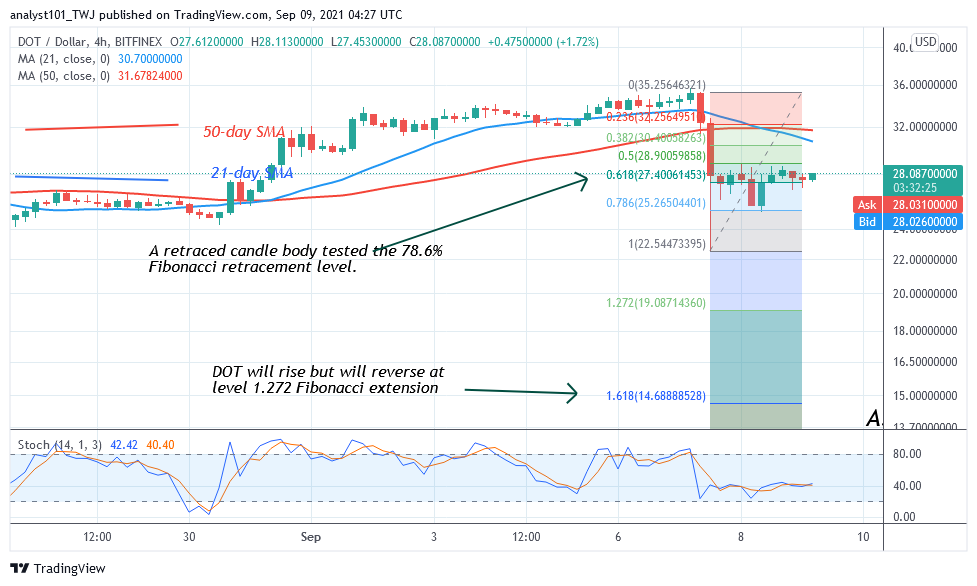
Polkadot is in a downward move. There is a tendency of further downside if the price breaks below the $22.50 support. Meanwhile, on the September 7 uptrend, a retraced candle body tested the 61.8% Fibonacci retracement level. The retracement indicates that DOT will fall to level 1.618 Fibonacci extension or level $14.68.
You can purchase crypto coins here. Buy Tokens
Note: Cryptosignals.org is not a financial advisor. Do your research before investing your funds in any financial asset or presented product or event. We are not responsible for your investing results