Pepe Unchained (PEPU/USD) Skyrockets; Faces Resistance at $0.0006
Estimated Reading Time: 2 minutes
Don’t invest unless you’re prepared to lose all the money you invest. This is a high-risk investment and you are unlikely to be protected if something goes wrong. Take 2 minutes to learn more

The latest analysis reveals that the price surged upward after establishing a key support level around the $0.00041 mark. Following this, the market climbed to approximately $0.00048, where a brief consolidation occurred. Once the price broke above the $0.00048 resistance, it gained strong bullish momentum, propelling it toward the $0.00055 level—another significant price zone. After a short pause at this point, renewed buying pressure pushed the price further, reaching as high as $0.00059, where it now faces notable resistance near the $0.0006 threshold.
Key Price Levels
- Resistance: $0.0010, $0.0015, $0.0020
- Support: $0.00041, $0.00040, $0.00035
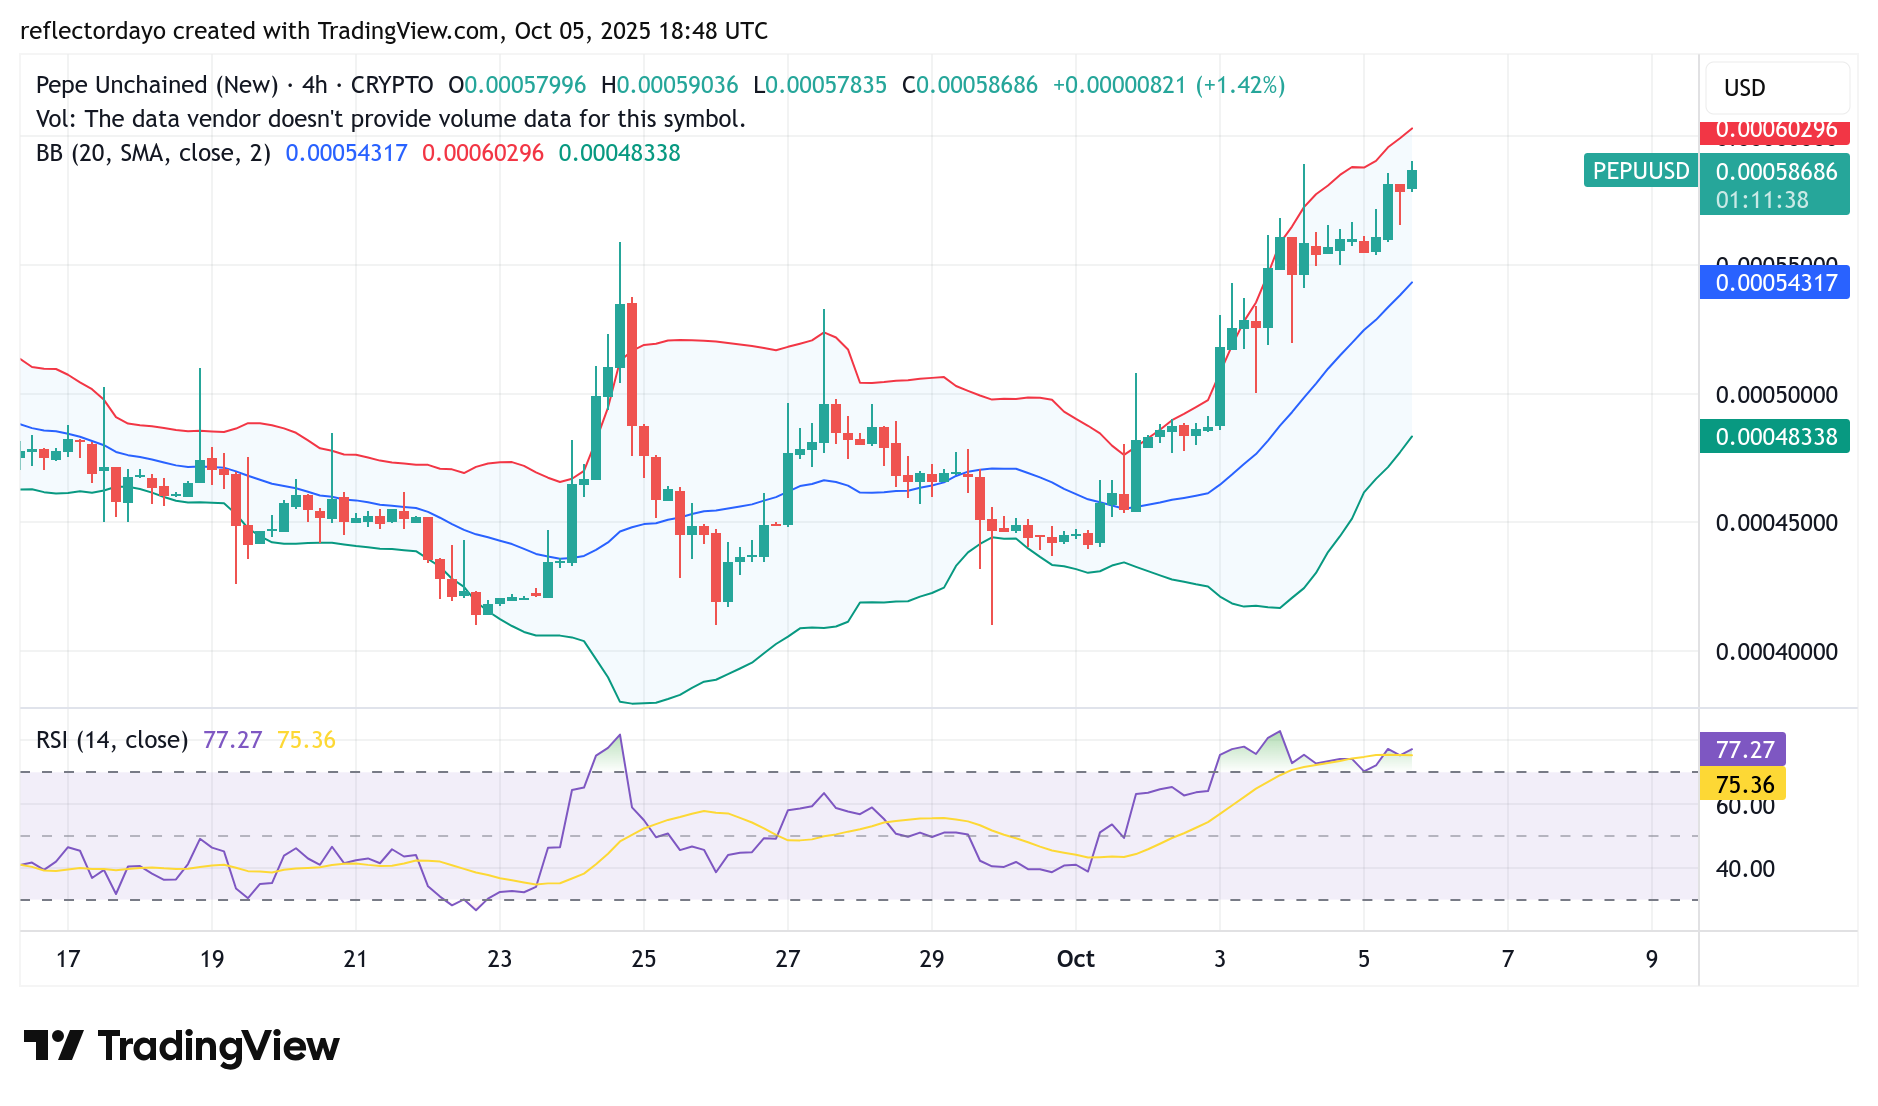
Pepe Unchained (PEPU/USD) 4-Hour Chart: Indicators’ Outlook
Bullish sentiment in the Pepe Unchained market remains strong and has persisted since the beginning of October. However, signs of caution are emerging as the price approaches the $0.0006 level, indicating the potential presence of significant bearish pressure around this zone.
The Bollinger Bands suggest heightened volatility, signaling that the bullish momentum may struggle to sustain a breakout above the $0.0006 resistance level. Additionally, the RSI is hovering above the 70 mark, indicating overbought conditions and suggesting that a market correction could be imminent.
If this correction unfolds, the $0.00055 level could serve as a potential reentry point for traders seeking to capitalize on the next bullish wave.
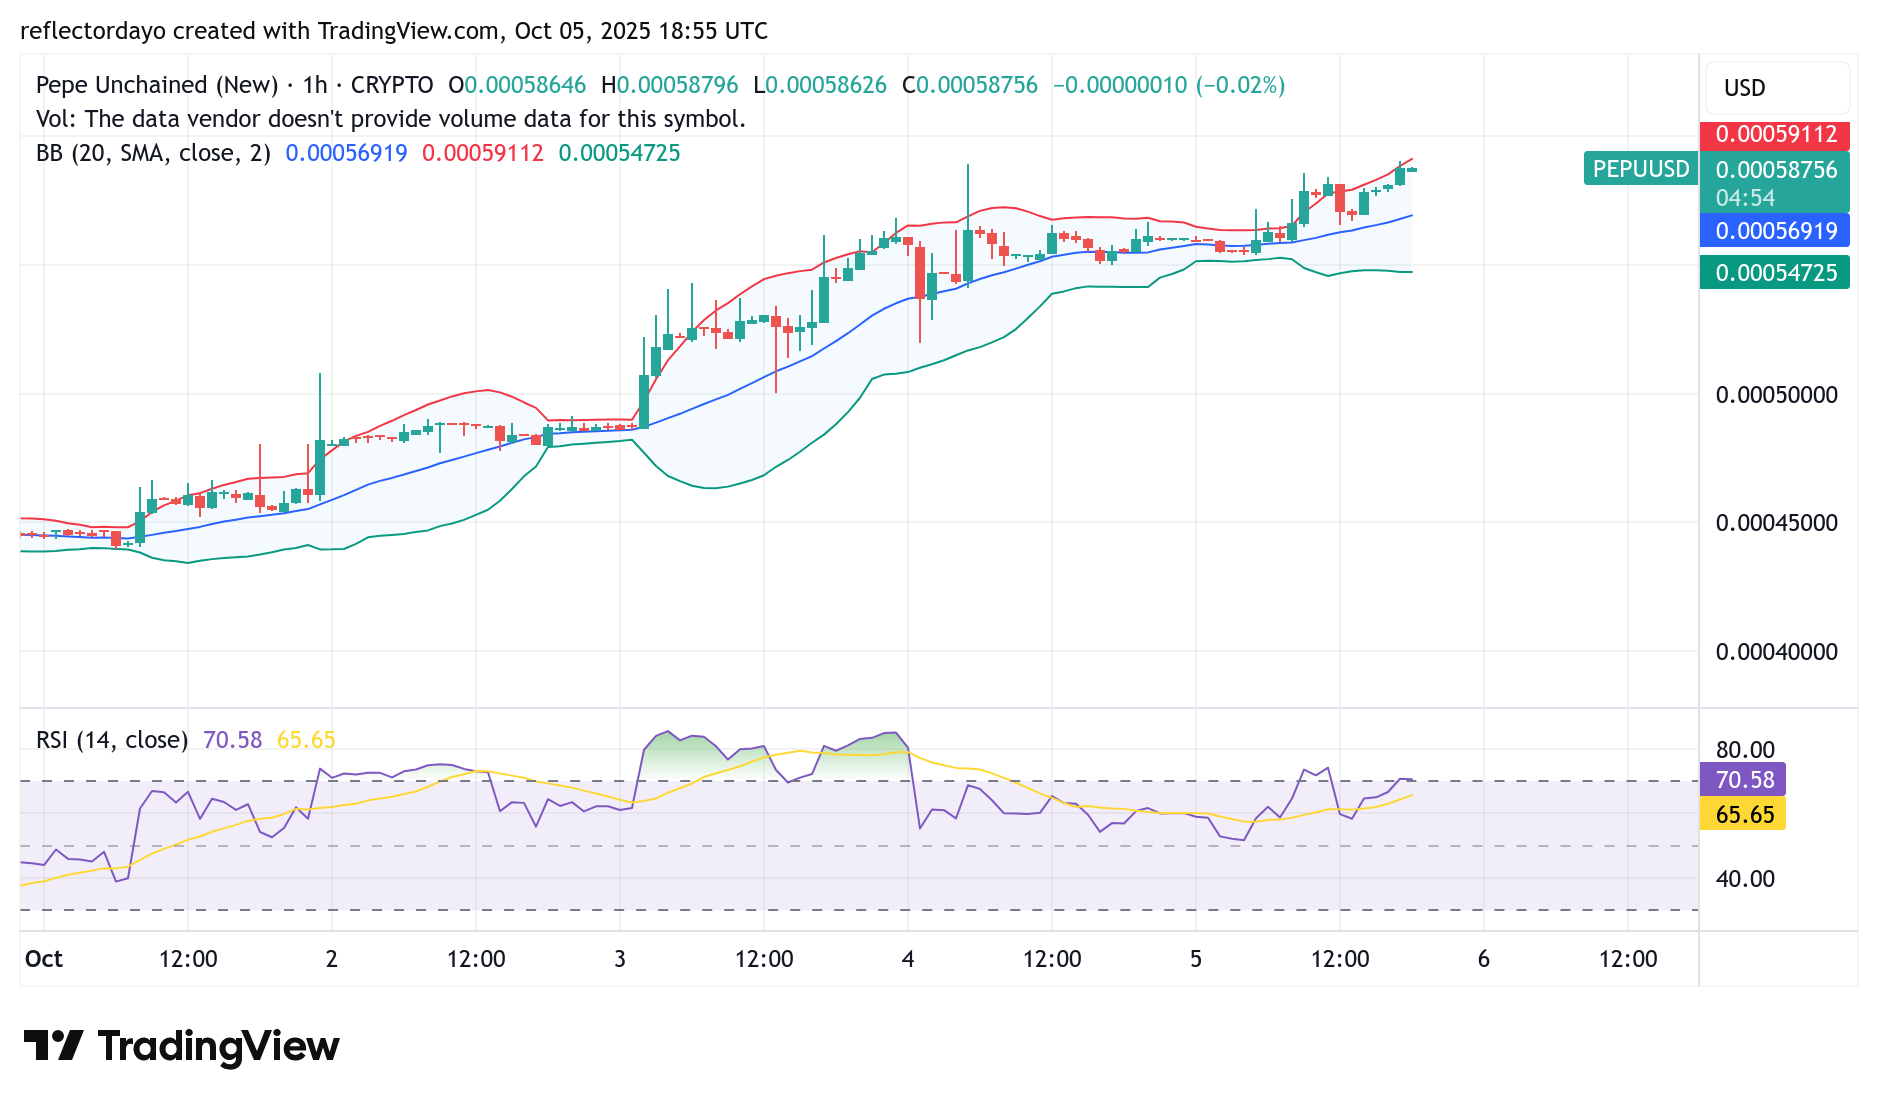
PEPU/USD 1-Hour Chart: Breakout Tensions Mount
While the $0.0006 level remains a formidable resistance zone, a closer look at the 1-hour chart reveals that the $0.00058 level is currently acting as a strong resistance point. During yesterday’s trading session, the price tested this level but failed to break through.
As the market approaches this zone once again, traders are beginning to exhibit signs of caution and indecision, with the ongoing candlestick showing a flattening price action. This suggests that a slight corrective pullback may be imminent before any potential continuation of the upward move.
Join the SPONGE community and get in on the next big crypto opportunity! Buy Sponge ($SPONGE) today