SPONGE/USD ($SPONGE) Continues at the $0.0001 Support, and Eyes Potential Upside
Estimated Reading Time: 2 minutes
Don’t invest unless you’re prepared to lose all the money you invest. This is a high-risk investment and you are unlikely to be protected if something goes wrong. Take 2 minutes to learn more

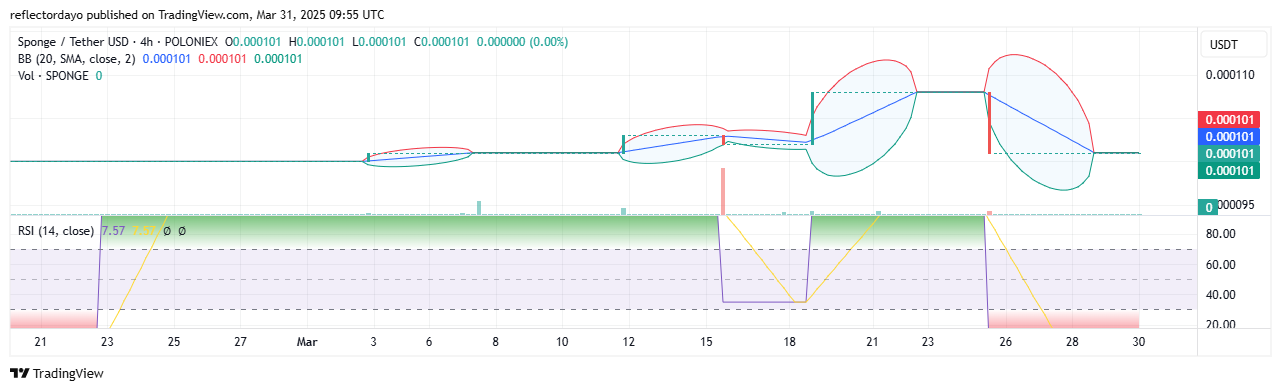
The SPONGE/USD market continues to consolidate around the $0.000101 level, positioning itself for a potential rebound. This time, the price aims to rally toward $0.00011, breaking through the immediate resistance at $0.000108. Following a sharp decline from approximately $0.000108, the price found support at $0.0001, where it has been moving sideways. However, recent indicator signals suggest that a bounce may be imminent.
Key Levels to Watch
- Resistance: $0.000110, $0.00012, $0.00013
- Support: $0.000090, $0.0000850, $0.00008
SPONGE/USD Market Analysis: Technical Indicators
The trading volume indicator reflects limited market activity, with demand and supply at a standstill around the $0.0001 level. However, the Bollinger Bands converging into a narrow price channel suggest that the market may be preparing for a breakout. Since the SPONGE/USD price is holding at a key support level within the bullish zone, this volatility squeeze could indicate an impending upward move.
Currently, the crypto signal remains in consolidation near $0.0001, while the Relative Strength Index (RSI) signals oversold conditions following the recent bearish momentum. This suggests a potential recovery rally toward $0.00011. However, for the bulls to gain control and break out of the $0.0001–$0.00011 range, they must generate stronger momentum near the $0.00011 resistance level.
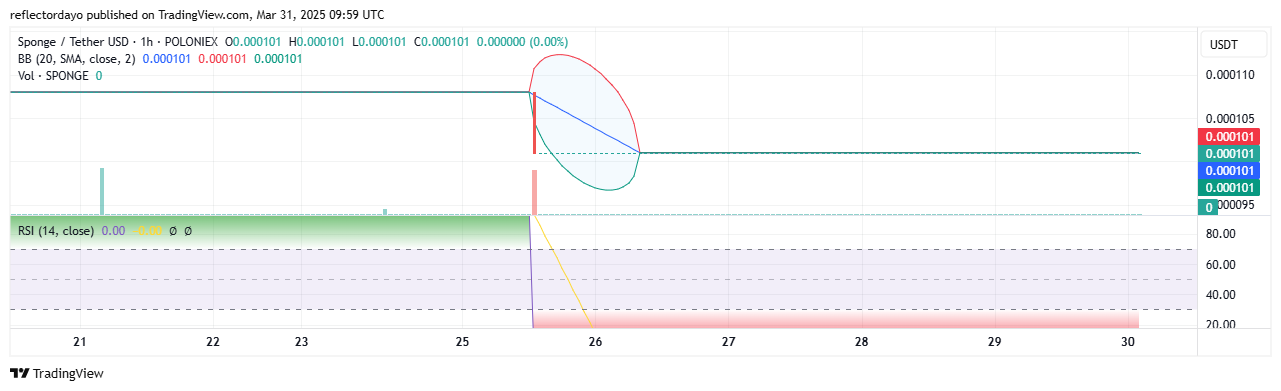
$SPONGE 1-Hour Chart Insights
A closer look at the 1-hour timeframe shows the Bollinger Bands tightening, indicating prolonged price consolidation and reduced volatility. This compression often precedes a breakout, suggesting that a sharp price movement may be imminent. Additionally, the RSI remains in oversold territory, strengthening the case for a bullish reversal. With strong support at $0.0001 and oversold market conditions, a rebound appears to be the most likely short-term scenario.
Buy $SPONGE!
The mind of an average crypto trader pic.twitter.com/87N2sFbz1j
— $SPONGE (@spongeoneth) March 25, 2025
Join the SPONGE community and be part of the next big crypto sensation! Buy Sponge ($SPONGE) today!