ChainLink (LINK/USDT) Bullish Recovery Attempt Amid Sideways Pressure
Estimated Reading Time: 3 minutes
Don’t invest unless you’re prepared to lose all the money you invest. This is a high-risk investment and you are unlikely to be protected if something goes wrong. Take 2 minutes to learn more

LINK/USDT Long-term Analysis: Bullish
The analysis for ChainLink against the Tether has become cautiously optimistic after a long period of correction from its last year high. However, the pair has been consolidating sideways, holding just above a key support zone.
Recently, the candles are showing signs of strength, especially with the price pushing back above the mid-Bollinger Band. The market is currently trading above $14.10, with signs that buyers may be preparing for more upside movement.
As it stands, the MACD is also showing a slowing bearish momentum, suggesting a possible uptrend as volume increases slightly. Meanwhile, buyers are not yet in control at the moment.
Currently, ChainLink trades at $15.53, printing over 19.15 million traded volumes for the week.
Technical Indicators
Major Resistance Levels: $17.17, $19.50, and $21.30
Major Support Levels: $14.10, $11.04, and $9.20
ChainLink Technical Analysis
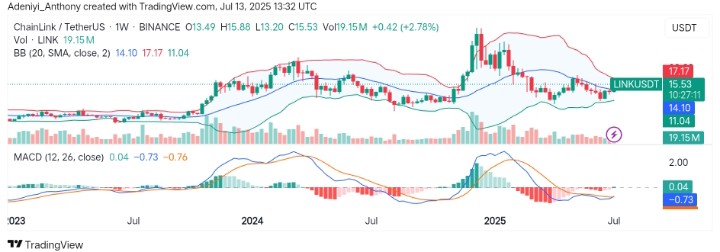
On the weekly timeframe, ChainLink against the Tether is currently on a mild bullish move as the setup calls for a breakout with a Bollinger Bands squeeze. However, the price appears to be pushing towards the $17.17 upper region with developing bullish volumes.
From another angle, the histogram of the MACD appears to be flattening as the signal lines slightly improve upward. To this end, a close above $15.70 may signal more movement to the north; otherwise, the price would continue to oscillate around this same spot.
LINK/USDT Analysis: Gearing Up for More Gains
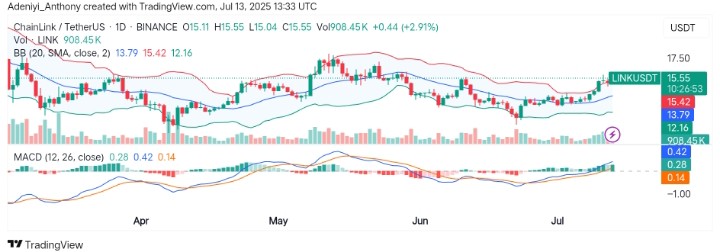
On the daily chart, LINK/USDT shows strong bullish momentum, closing at $15.55 after a clean breakout above the upper limit. However, the MACD has also displayed a bullish crossover, confirming rising buying interest with increasing histogram bars.
From another perspective, the Bollinger Bands are widening, signaling the beginning of volatility expansion, as the price tends towards the $17.00 resistance.
To this end, the volume is healthy, suggesting bulls are in control in the short term.
Hence, if momentum continues, the price could retest the weekly resistance of $17.17 very soon.
You can purchase crypto coins here. Buy LBlock