SPONGE/USD ($SPONGE) Analysis: Potential Rebound at Key Support Level
Estimated Reading Time: 2 minutes
Don’t invest unless you’re prepared to lose all the money you invest. This is a high-risk investment and you are unlikely to be protected if something goes wrong. Take 2 minutes to learn more

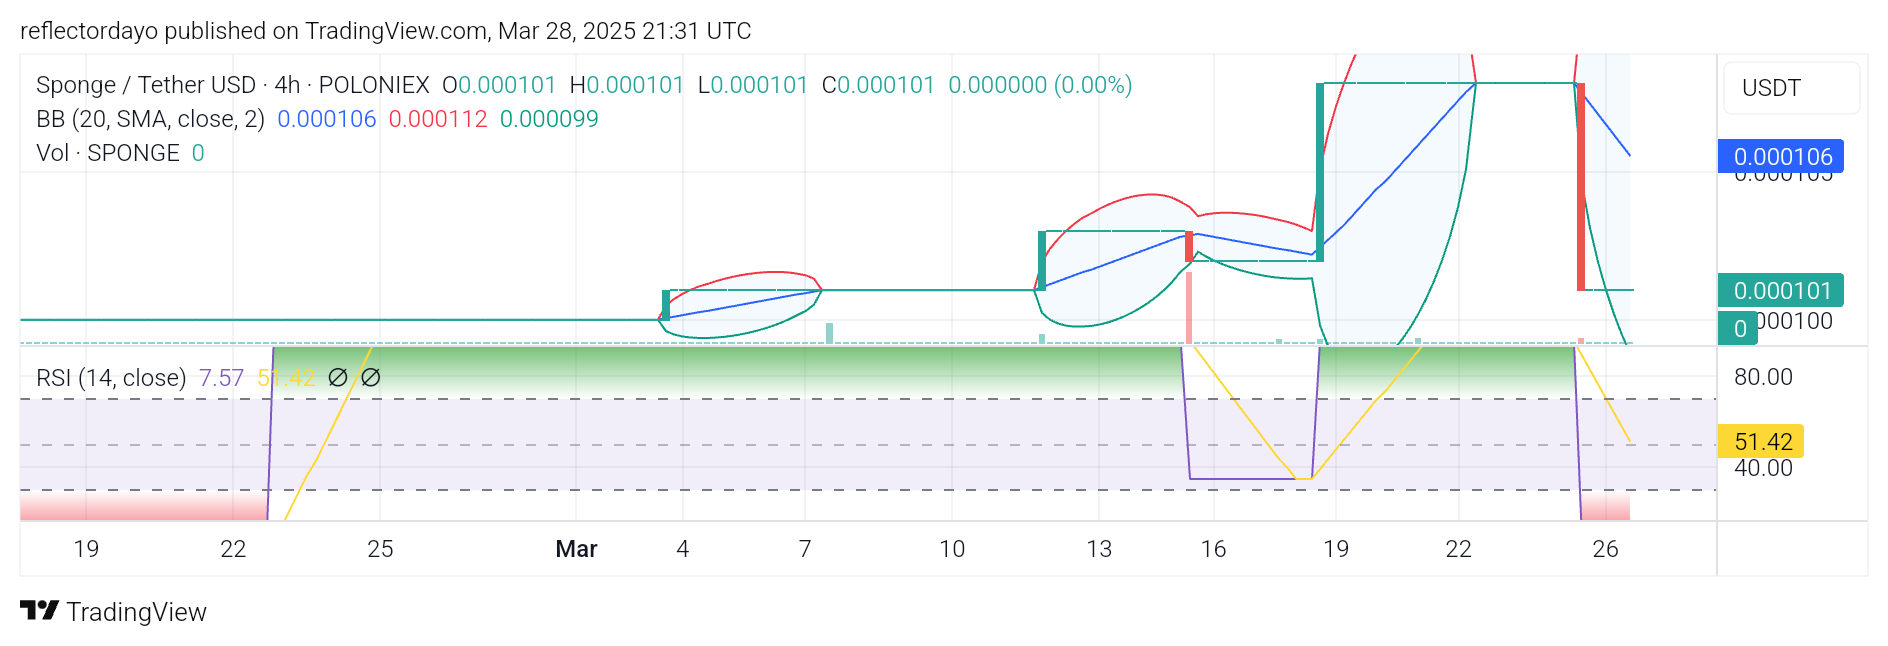
The $SPONGE market has exhibited price consolidation near the $0.0001 support level, following a recent decline from $0.000108. The market has demonstrated established support and resistance zones, presenting potential trading opportunities.
Key Technical Levels:
- Resistance: $0.000110, $0.00012, $0.00013
- Support: $0.000090, $0.0000850, $0.00008
SPONGE/USD Technical Indicators and Market Observations:
Trading volume remains relatively subdued, characterized by low histogram values, punctuated by occasional spikes that correlate with price volatility. The Relative Strength Index (RSI) indicates oversold conditions, suggesting the potential for a bullish reversal. The immediate target in the $SPONGE for a potential upward movement is the $0.00011 resistance level, requiring significant buying momentum to breach.
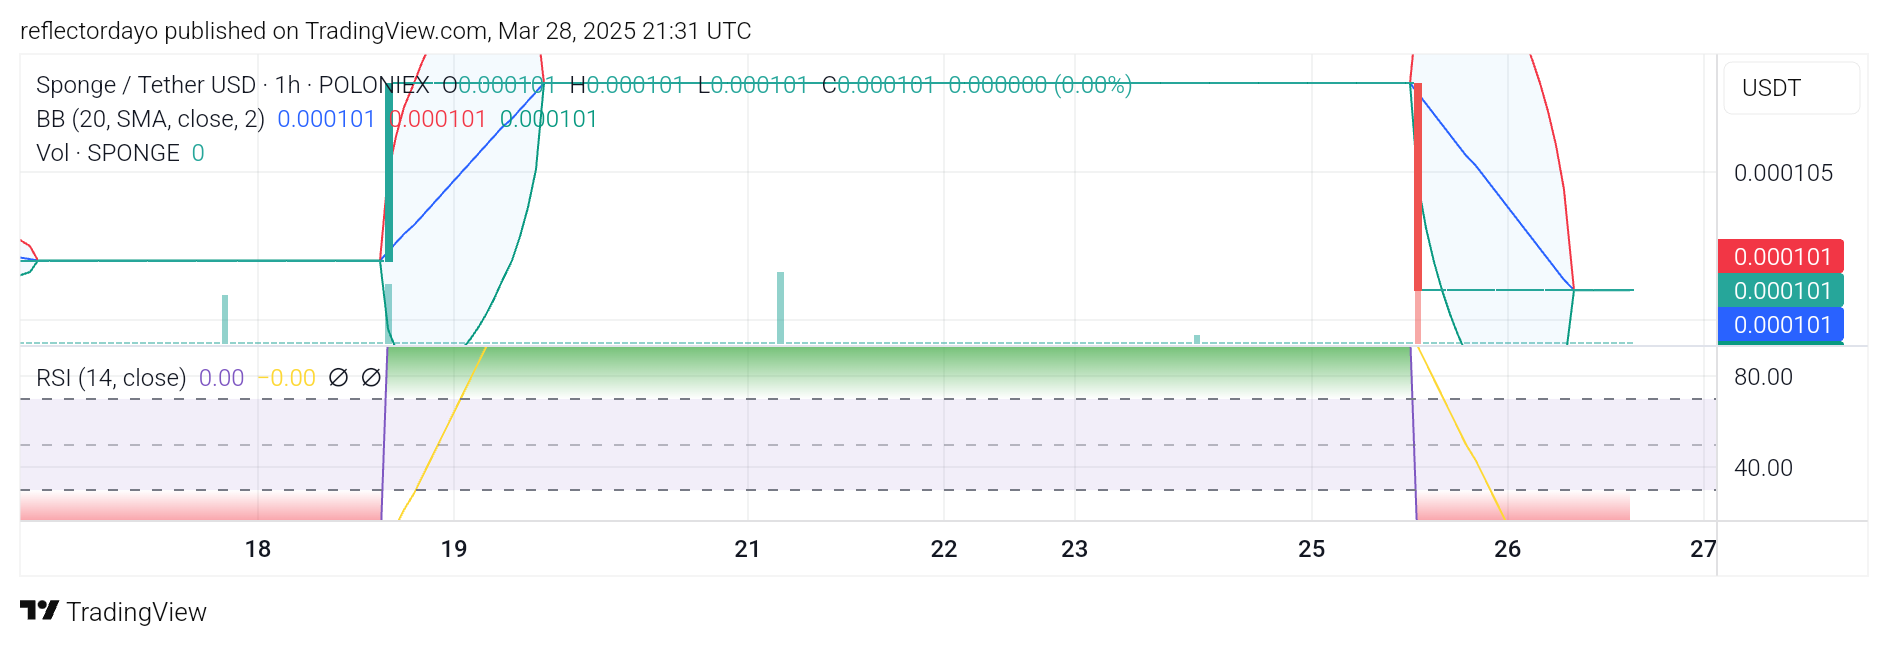
$SPONGE 1-Hour Chart Analysis:
The 1-hour chart reveals a tightening of Bollinger Bands, indicative of a potential upcoming breakout. The RSI reinforces the oversold signal, supporting the possibility of a near-term bullish rebound. The current price proximity to the $0.0001 support level suggests a potential upward trajectory, with an initial target of $0.00011.
The $SPONGE market is currently positioned at a critical support level, with technical indicators suggesting the possibility of a bullish rebound. Traders should monitor volume and price action closely for confirmation of a reversal.
The mind of an average crypto trader pic.twitter.com/87N2sFbz1j
— $SPONGE (@spongeoneth) March 25, 2025
Join the SPONGE community and be part of the next big crypto sensation! Buy Sponge ($SPONGE) today!