Chainlink (LINK/USDT) is Gaining Strength; Is a Bigger Move Coming?
Estimated Reading Time: 2 minutes
Don’t invest unless you’re prepared to lose all the money you invest. This is a high-risk investment and you are unlikely to be protected if something goes wrong. Take 2 minutes to learn more

LINK/USDT Long-term Analysis: Ranging
The Chainlink and Tether trading pair has been moving sideways after a strong rise late last year. However, the price is trying to go up again after bouncing from a low point.
Recently, buyers are beginning to show interest, but the coin still needs to push through a key resistance to confirm a new uptrend. As it stands, the market is currently neutral but turning slightly bullish, especially as LINK holds above-recent support.
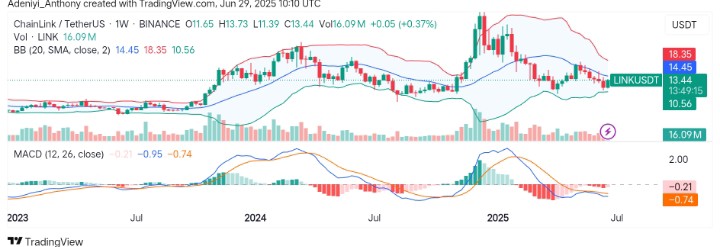
Currently, ChainLink trades at $13.44 with over 16.09 million traded volumes for the week.
Technical Indicators
Major Resistance Levels: $14.45, $16.80, and $18.35
Major Support Levels: $13.00, $10.56, and $8.90
ChainLink Technical Analysis
The market for ChainLink against the Tether on the weekly timeframe is showing signs of recovery. It has bounced off support at the lower Bollinger Band and is trying to climb again. If bulls can push it above $14.45, we may see more upside in the coming weeks. But if it fails there, LINK could stay stuck in the current range for a bit longer.
On the other hand, the MACD lines are still below zero, but the gap is getting smaller. This may mean that selling pressure is fading as trading activity suggests a less selling tendency.
LINK/USDT Analysis: What Happens Next?
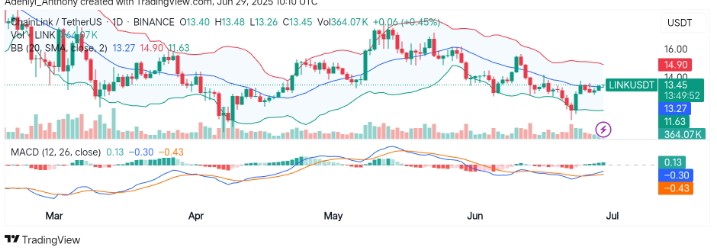
On the daily chart, LINK/USDT is bouncing off $11.63 support, making a steady move above the Bollinger Band midline at $13.27. However, the price is now testing a key zone around $13.45, just under the upper band, signaling growing buyer interest.
From another perspective, the MACD has crossed above the signal line, confirming short-term bullish momentum. However, the Bollinger Bands are starting to narrow, indicating a possible breakout setup if volatility increases.
To this end, a daily close above $14.00 could trigger a rally toward the weekly target zones.
You can purchase crypto coins here. Buy LBlock