Chainlink (LINK/USDT) at a Critical Demand Region: What’s Next?
Estimated Reading Time: 3 minutes
Don’t invest unless you’re prepared to lose all the money you invest. This is a high-risk investment and you are unlikely to be protected if something goes wrong. Take 2 minutes to learn more

Chainlink Long-term Analysis: Ranging
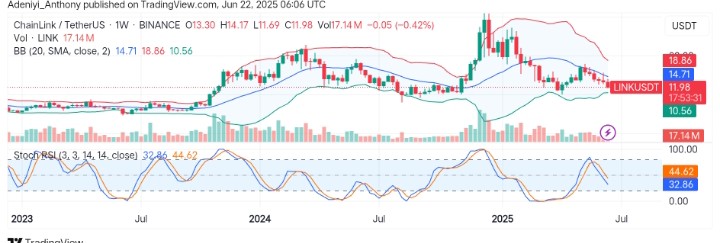
After a strong rally that peaked above the $20.00 level at the beginning of the year, Chainlink against the Tether has retraced steadily, now residing around the lower line of the Bollinger Bands. However, the market sentiment appears bearish, with declining volume and flattening momentum despite the growing adoption of the ecosystem’s interoperability protocol.
Recently, the pair failed to pierce through the mid band, pulling back since then. However, unless a reversal pattern is formed, the bears could push the pair’s price lower toward historical demand zones.
Currently, Chainlink trades at $11.98, recording over 17 million traded volumes for the week.
Technical Indicators
Major Resistance Levels: $14.71, $18.86, and $20.00
Major Support Levels: $10.56, $9.40, and $7.80
Chainlink Technical Analysis
The analysis of Chainlink against the Tether on the weekly timeframe appears to be in a corrective downtrend following a strong upside move at the beginning of the year. However, the price seems to be operating near the lower Bollinger band, though still controlled by the bear but suggests a mean reversion if volume increases.
On the other hand, the Stochastic RSI tends to the south, heading into the oversold region. However, recent candlestick formation suggests buyers’ interest and a bullish crossover at this level would signal an early reversal attempt.
To this end, the pair needs to cross above the $13.00 level for a confirmed bullish move. However, as it stands, a relentless effort from the sellers would pull the price beyond $10.50.
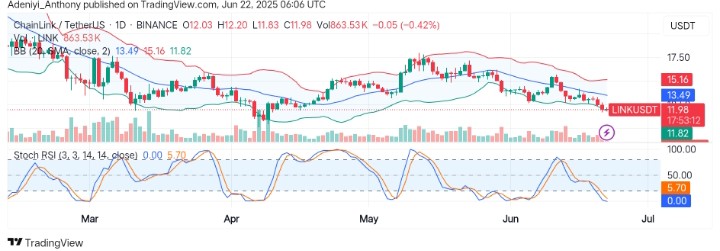
LINK/USDT Analysis: Awaiting a Reversal or Continuation?
On the daily chart, LINK/USDT appears to be trading just above the lower band at $11.83, suggesting a bearish pressure as the price presses against the lower segment of the indicator.
However, on the other end, the Stochastic oscillator is deeply oversold, signaling a move to the north if the bulls’ participation increases, as recent candles suggest weakening bearish pressure.
To this end, though the volume remains modest at 863 thousand for the day, a move above $13.00 with increasing bullish participation could validate a bounce; otherwise, the pair may see a continuation of the current trend.
You can purchase crypto coins here. Buy LBlock