Chainlink (LINK/USDT) Faces Tight Consolidation: What’s Next?
Estimated Reading Time: 3 minutes
Don’t invest unless you’re prepared to lose all the money you invest. This is a high-risk investment and you are unlikely to be protected if something goes wrong. Take 2 minutes to learn more

Chainlink Long-term Analysis: Ranging
Over the past year, the market for Chainlink against the Tether has experienced a volatile journey. The pair surged above $22.00 in early 2024 before a downward movement, retracing towards support around the $11.00 level.
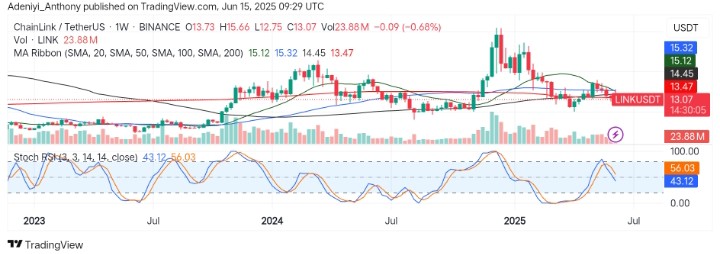
However, in recent times, the pair has shown signs of consolidation, oscillating between $12.00 and $15.00, projecting ongoing indecision in the market. At the moment, the price is trading below crucial moving averages, but the flattened volume and equilibrium-positioned oscillator suggest a potential breakout in either direction.
Currently, Chainlink trades at $13.07, printing 23.88 million traded volumes for the week.
Technical Indicators
Major Resistance Levels: $14.00, $15.32, and $17.50
Major Support Levels: $13.00, $12.00, and $10.60
Chainlink Technical Analysis
The analysis of Chainlink against the Tether on a weekly timeframe shows the pair is at a crossroads, with the price acting under important moving averages. However, the line at $15.12 looks like it is flattening; this could foreshadow a larger trend shift if broken to the upside.
On the other hand, the Stochastic RSI indicates a neutral to bearish move as the lines extend further to the south with modest participation. To this end, a move above $15.12 in the near term would suggest a change in the trend direction, while failure to hold above $13.00 would signal further decline.
LINK/USDT Analysis: What to Expect
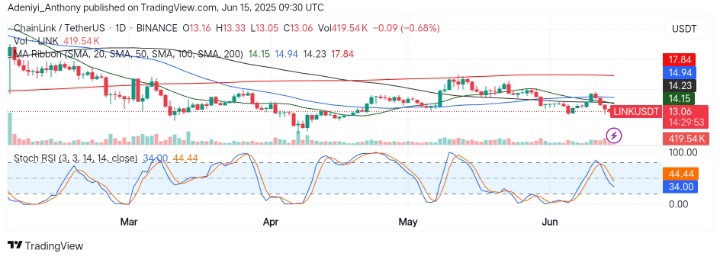
The daily chart of the LINK/USDT shows the pair, like the weekly outlook, appears to be trading below all moving averages, reinforcing a bearish setup after facing rejection around $14.23.
Additionally, the Stochastic oscillator looks to be heading southwards after breaking below the 50-mark level, with the blue line hugging 34.00 with a relatively low volume.
To this end, immediate support lies at $13.00, and a breach of this support system would unlock a move towards $12.00 unless the bulls re-enter the market.
You can purchase crypto coins here. Buy LBlock