Chainlink (LINK/USDT) Faces Rejection After Hitting the $25.99
Estimated Reading Time: 3 minutes
Don’t invest unless you’re prepared to lose all the money you invest. This is a high-risk investment and you are unlikely to be protected if something goes wrong. Take 2 minutes to learn more

Chainlink Long-term Analysis: Bullish
The market for Chainlink (LINK) against the Tether (USDT) has demonstrated significant volatility in previous weeks. This is evidenced in the retracement after a strong rally towards the $25.99 level.
However, recent price action shows that LINK/USDT has dropped by 3.53% compared to last week’s close. This pullback could be attributed to the broader crypto market sentiment and a cooling-off period before an explosive uptrend.
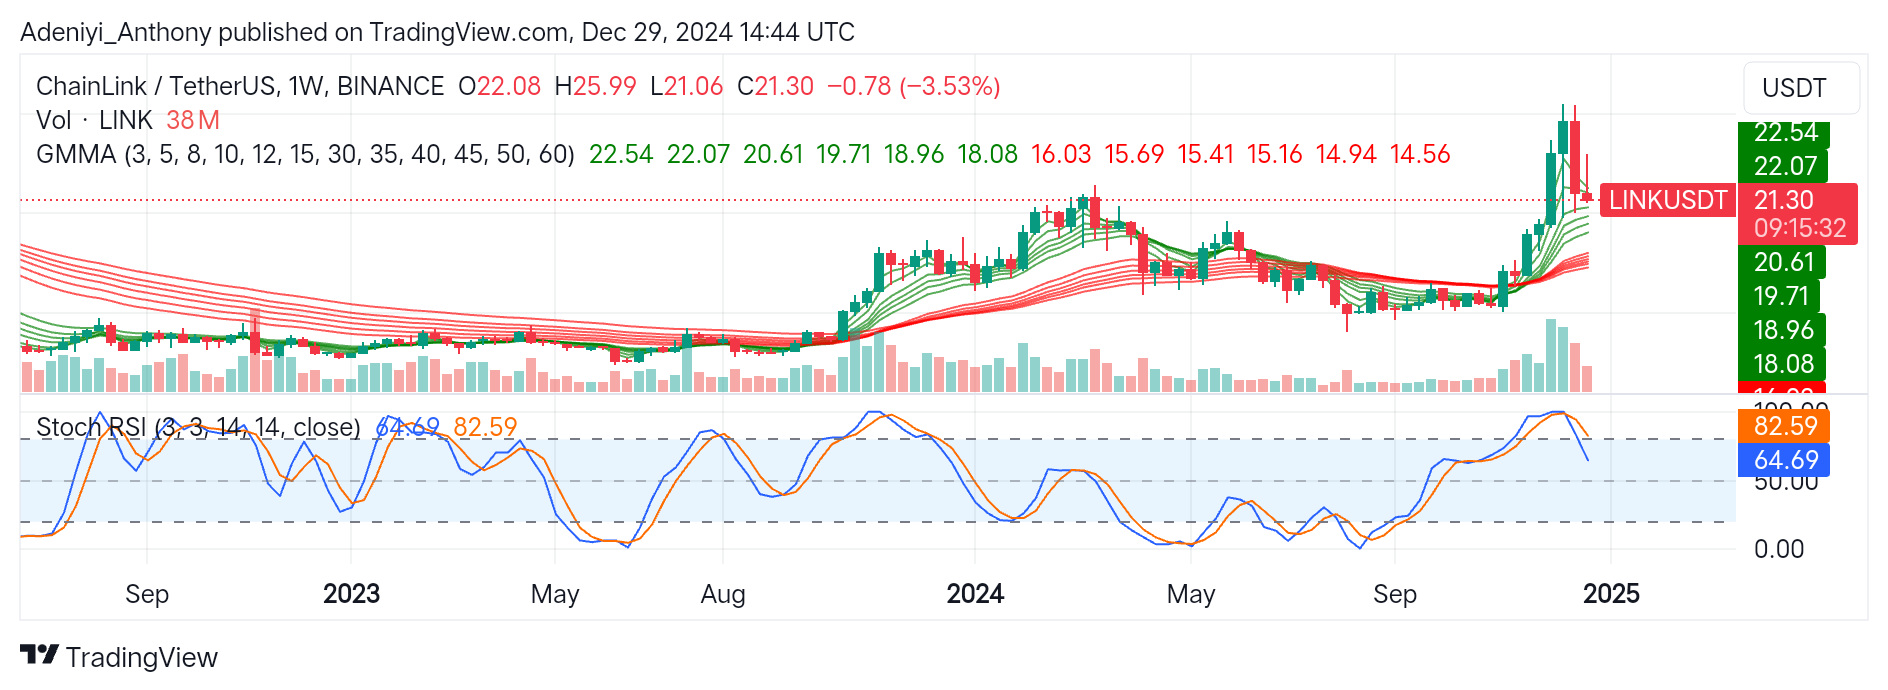
To this end, further decline may be on the horizon as the Guppy Multiple Moving Averages (GMMAs) and the Stochastic RSI suggest LINK/USDT is on a short-term pullback towards the $20.00 level.
Currently, Chainlink is trading at $21.30 with 38 million traded volumes.
Technical Indicators
Major Resistance Levels: $22.07, $22.54, and $23.00
Major Support Levels: $20.61, $19.71, and $18.08
Chainlink Technical Analysis
The analysis of Chainlink on a weekly timeframe shows that the coin is retracing after hitting $25.99, reflecting increasing seller’s dominance and suggesting a short-term correction. However, as the price tends towards the $20.00 level, the short-period EMAs seem to converge towards the long EMAs, indicating the bullish momentum may be waning. A breakdown toward $19.71 could signal a deeper correction, while a rebound above $22.07 would confirm a renewed bullish interest.
Furthermore, the Stochastic RSI at the bottom of the chart suggests LINK/USDT oscillates in the overbought region but is beginning to cool off. This is seen in the placement of the orange and blue lines.
However, a sustained movement to the south would indicate a further downtrend.This will reshape the overall sentiment and signal a correction towards $19.71 and $18.08. Conversely, a pause at the 50-mark level with strong bullish pressure would lead to an upside reversal.
LINK/USDT Analysis: What to Expect
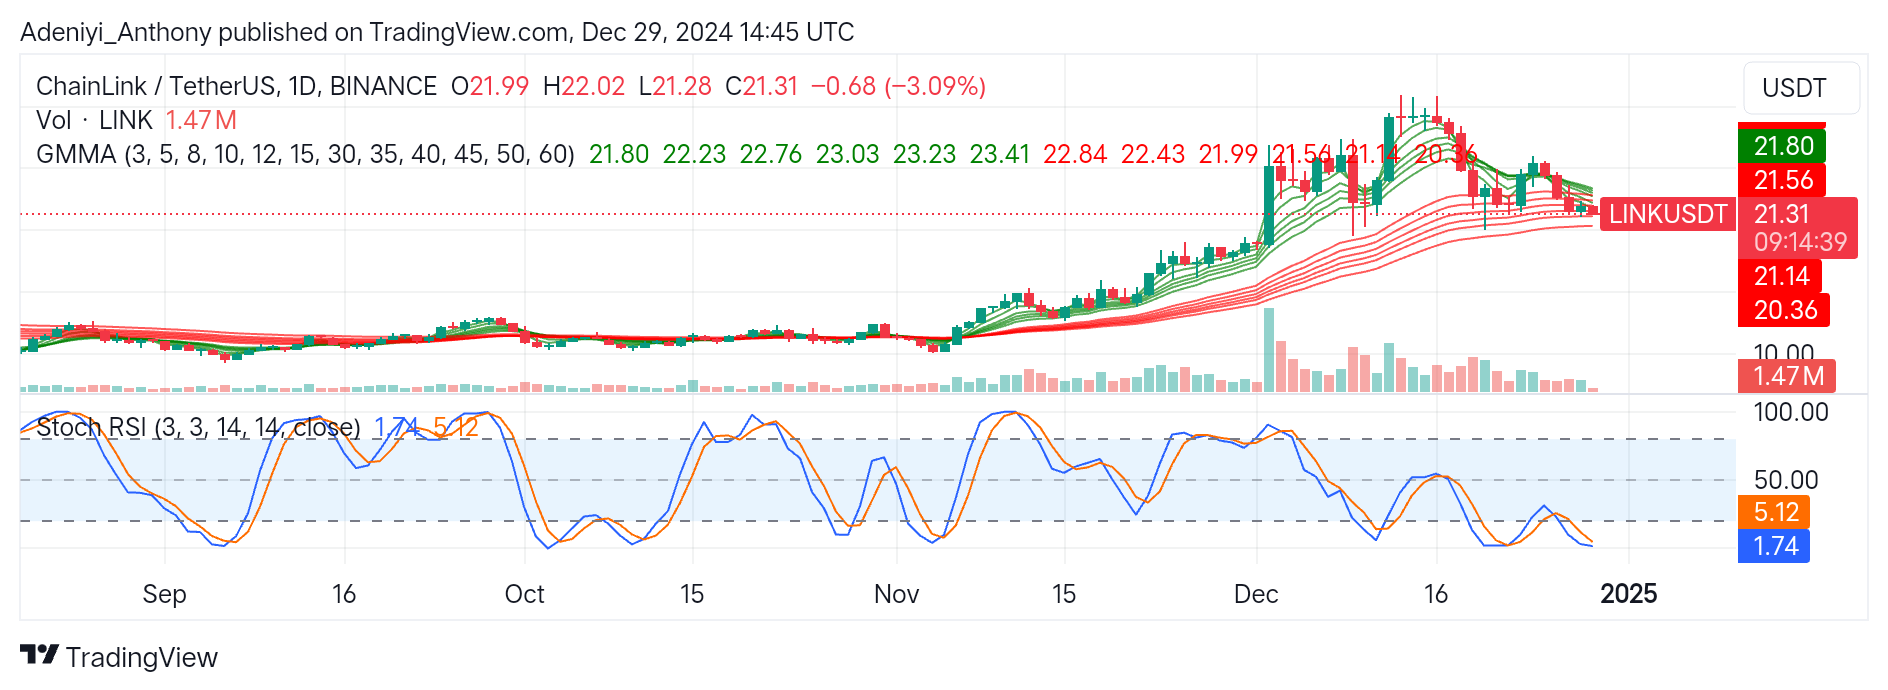
During the daily timeframe, the analysis of LINK/USDT shows that the pair is oscillating around the $21.31 and $21.56 levels after a recent rally. This suggests a potential shift in the near term.
The chart shows that the GMMAs are intertwined, suggesting a potential reduction in the bullish strength. However, a break below $20.36 would indicate increased bearish pressure; otherwise, a rebound may be expected if the price holds above the current level.
To this end, the Stochastic oscillator shows the pair is currently oversold with extremely low values. This may be an indication of a potential bounce point; otherwise, if the lines remain in the oversold region, it could imply a continued downtrend.
You can purchase crypto coins here. Buy LBlock