Chainlink (LINK/USDT) Bullish Rally Suspended, Dips Below $25.36 Critical Level
Estimated Reading Time: 3 minutes
Don’t invest unless you’re prepared to lose all the money you invest. This is a high-risk investment and you are unlikely to be protected if something goes wrong. Take 2 minutes to learn more

Chainlink Long-term Analysis: Bullish
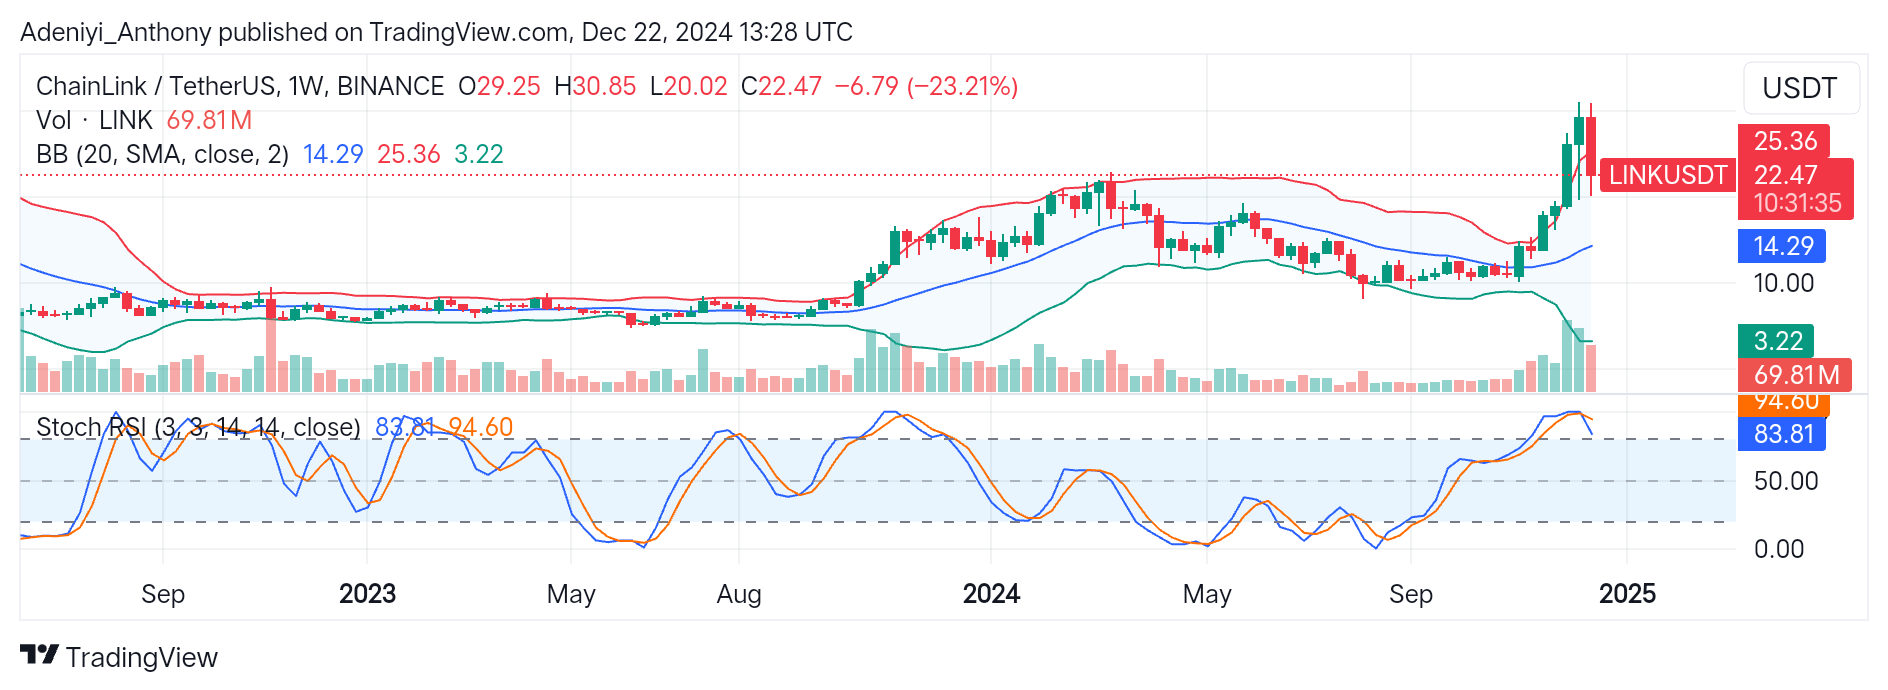
For several weeks, Chainlink against the Tether has experienced an uptrend after breaking away from a consolidation phase at around $14.29 in late September. This can be seen in the rising trend and the formation of higher highs.
The recent price movement around the upper band at $25.36 shows that the pair is down by 23.21% this week alone. This sharp move suggests a strong bearish correction after recent months’ rally.
However, the position of the Stochastic and the price movement around the upper Bollinger band suggest the pair still operates in the overbought condition. Conversely, the formation of the bearish candlestick speaks otherwise as it extends towards the mid-band at $14.29.
Currently, Chainlink is trading at $22.47 with over 69 million weekly transactions.
Technical Indicators
Major Resistance Levels: $25.36, $30.00, and $35.00
Major Support Levels: $20.00, $14.29, and $10.00
Chainlink Technical Analysis
The weekly analysis of Chainlink against the Tether shows that the pair is experiencing a pullback after a major rally. However, the overall market setup remains bullish. The recent price action around the upper limit suggests an impending correction as the price seems to have seen a prolonged uptrend.
Therefore, a pullback to the $20.00 psychological level may be a good re-entry point for another rally. Additionally, the oscillator at the bottom of the chart also indicates an overbought condition as the lines read extreme values of 94.60 and 83.81. This suggests the recent fall in price may be a result of a minor take-profit.
To this end, traders should watch out for the spike in volume, changes in the behavior of the Stochastic lines, and potential signs of exhaustion of selling pressure for confirmation of a bullish trajectory above $25.36 towards $30.00.
LINK/USDT Analysis: What’s Next?
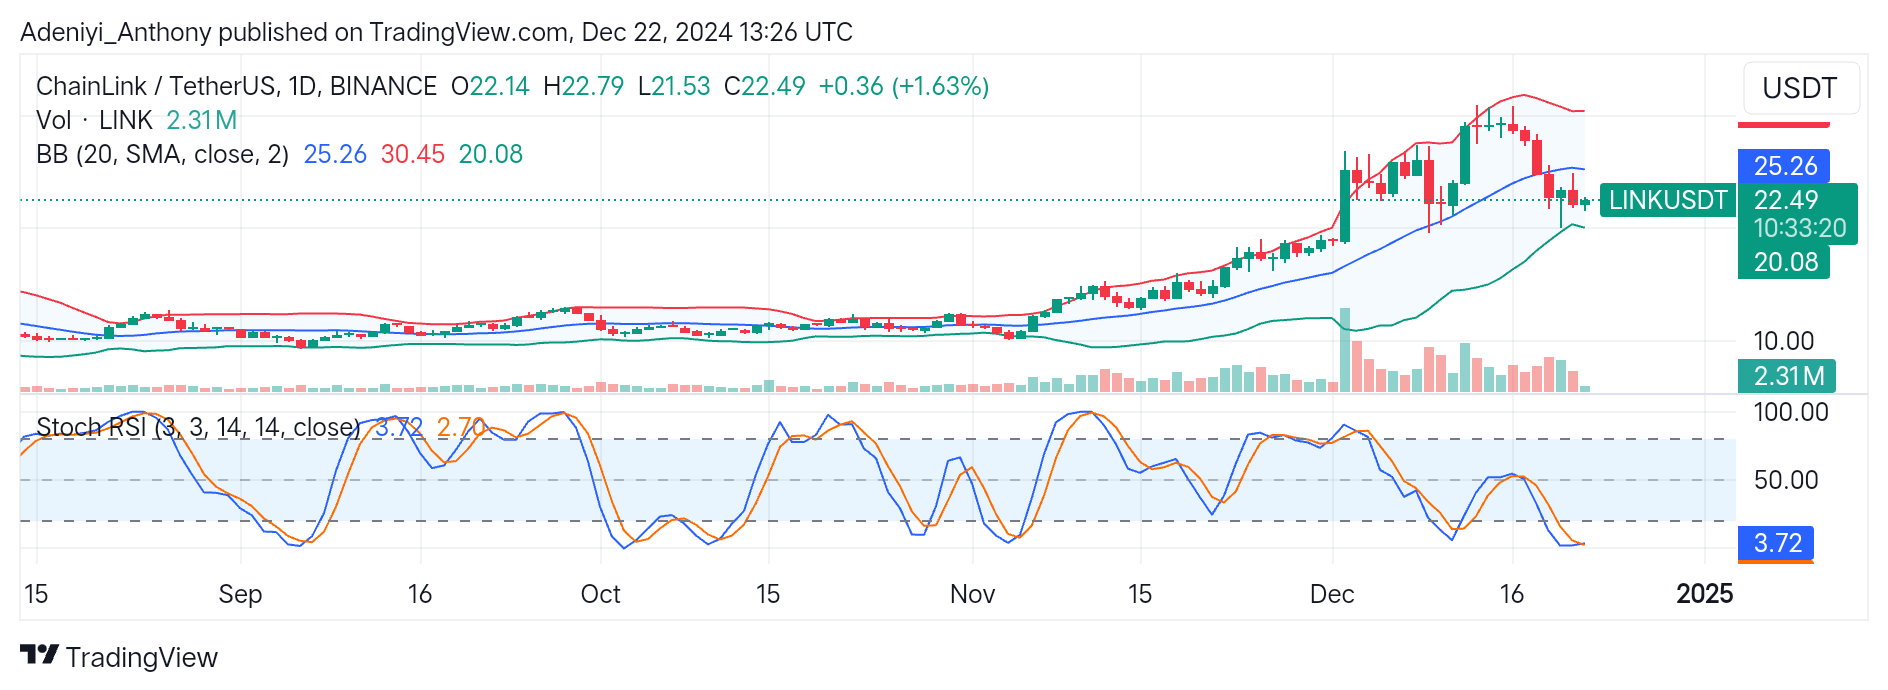
On the daily timeframe, LINK/USDT shows signs of a slight recovery of 1.65% from the recent low. This signals a potential pause in the recent bearish momentum as the price aims to break above the $22.49 level with 2.31 million traded volumes.
At the bottom of the chart, the Stochastic oscillator indicates an oversold condition. However, the upward curvature of the lines at 3.72 and 2.70 signals an impending upside movement.
Therefore, the $25.36 level remains an important point for a confirmed bullish reversal; otherwise, the selling pressure may continue.
You can purchase crypto coins here. Buy LBlock