Litecoin (LTC) Price Prediction: LTC/USDT Keeps a General Upward Trajectory
Estimated Reading Time: 3 minutes
Don’t invest unless you’re prepared to lose all the money you invest. This is a high-risk investment and you are unlikely to be protected if something goes wrong. Take 2 minutes to learn more

Date: September 16, 2025
The Litecoin market started a downward course three sessions ago. But just when it seemed bears had seized control, bulls began staging resistance against further bearish advances. Will the resistance survive? Let’s find out below.
Key Price Levels
Resistance: $115, $120, $125
Support: $110, $105, $100
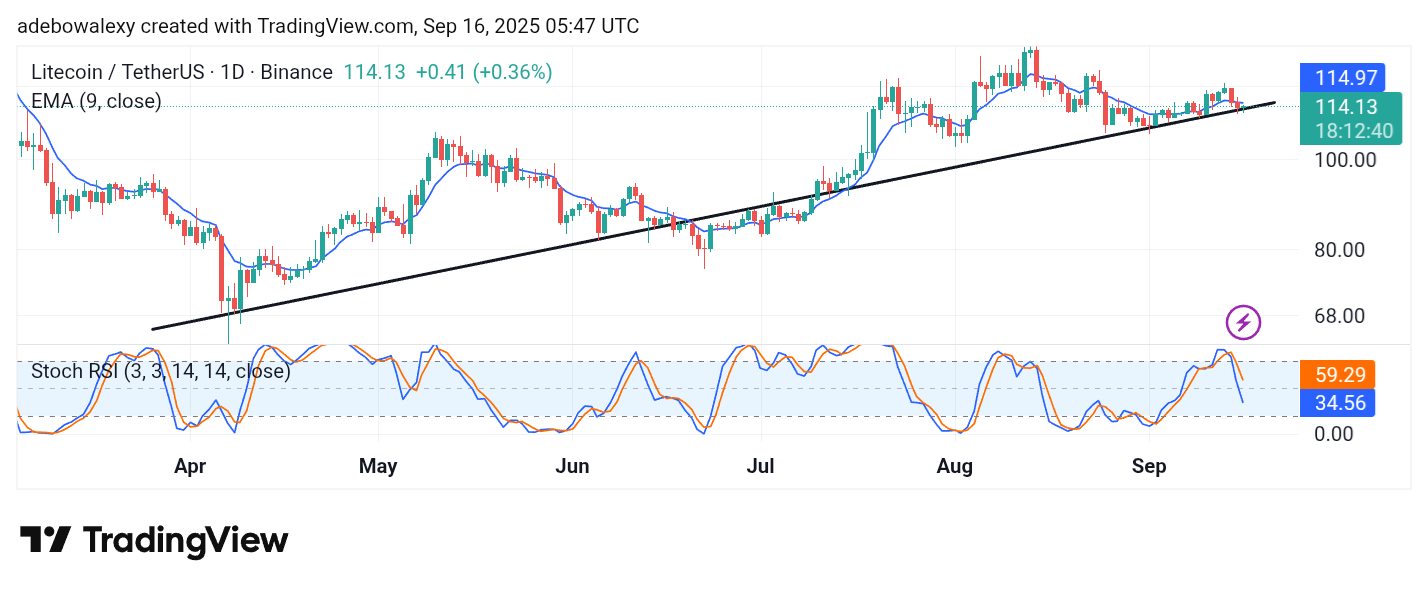
The current session in the Litecoin daily market has appeared green. This price candle is positioned below the 9-day Exponential Moving Average (EMA) line. The candle appears like a hammer, and its formation may hold bullish hopes. Meanwhile, the Stochastic Relative Strength Index (SRSI) indicator lines are still descending deeper into the oversold region. This aligns with the strong bearish momentum observed over the past two sessions.
Litecoin (LTC) Price Prediction: LTC/USDT Bullish Resistance Faces an Uphill Task
Although it doesn’t seem a notable feat for buyers to initiate a re-entry at this point, the attempt still appears overwhelmed from a longer-term perspective. The last green price candle in the Litecoin daily market has appeared below the 9-day EMA curve.
Considering the size of this bullish retracement, upside forces seem subdued. Simultaneously, it should be noted that the SRSI lines are still descending steeply into the oversold zone. Nevertheless, the fact that bulls are maintaining the long-term upward trend supplies some bullish hopes.
Litecoin (LTC) Price Prediction: LTC/USDT Is Testing a Key Resistance (4-Hour Chart)
On the Litecoin 4-hour price chart, it is visible that price action is probing the 9-day EMA line. The last price candle here has a more conspicuous appearance compared to the daily chart. In fact, the ongoing session has recovered the market from the losses of the previous session.
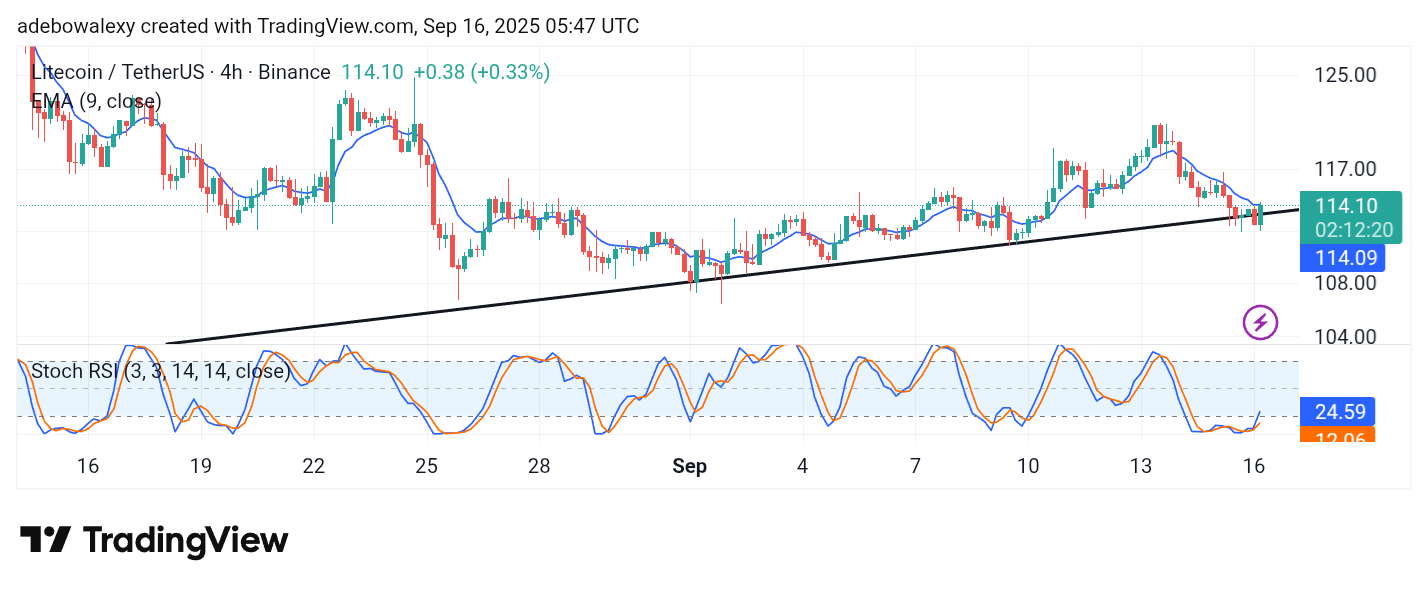
At the same time, the SRSI indicator lines have delivered an upward crossover in the oversold region. Technically, this aligns with the ongoing upward rebound in the market. However, the token still trades generally below the 9-day EMA, and the SRSI indicator lines remain in the oversold region.
Therefore, traders may choose to wait for price action to surface above the 9-day EMA curve before taking stronger bullish stands toward the $118 and $120 price levels.