$SPONGE (SPONGE/USD): Bulls Charge Towards $0.00004 Resistance
Estimated Reading Time: 3 minutes
Don’t invest unless you’re prepared to lose all the money you invest. This is a high-risk investment and you are unlikely to be protected if something goes wrong. Take 2 minutes to learn more

In recent trading sessions, the $SPONGE market experienced a renewed surge in bullish momentum. However, the $0.00004 price level has proven to be a significant obstacle to the advancing recovery. While the bears continue to exert pressure at this critical juncture, the bulls are showing resilience, repeatedly challenging this resistance in hopes of a breakthrough. If this persistence continues, the market retains the potential for a bullish bounce.
Key Market Dynamics:
- Resistance Levels: $0.00005, $0.000055, $0.000060
- Support Levels: $0.000020, $0.0000195, $0.000019
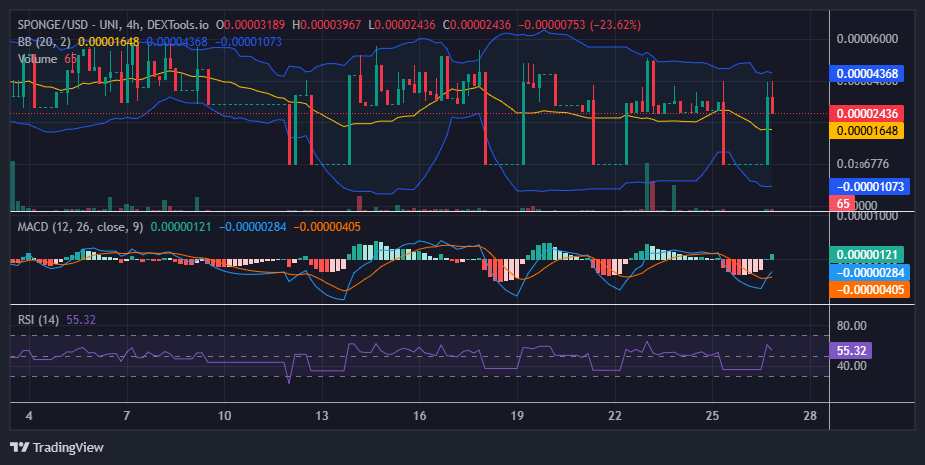
$SPONGE (SPONGE/USD) Technical Outlook
The price struggle in the $SPONGE market has stabilized, dipping slightly below the $0.00003 level. This shift has also caused the key resistance level to adjust to $0.00004. This development in the crypto signal may be attributed to the bears finding a new low at $0.0000006. Despite the decline in support levels, the market has largely remained steady, hovering around $0.0000006.
Strong support has emerged at $0.0000006, with the equilibrium point holding firm at $0.000026. The frequent price activity in this region has led to reduced volatility, indicating a potential setup for a bounce. Encouragingly, the MACD indicator has displayed a bullish crossover below the zero line, signaling a revival in bullish sentiment. For this momentum to be confirmed, a successful breakout and sustained move above the $0.00004 resistance level will be essential in determining the market’s next significant direction.
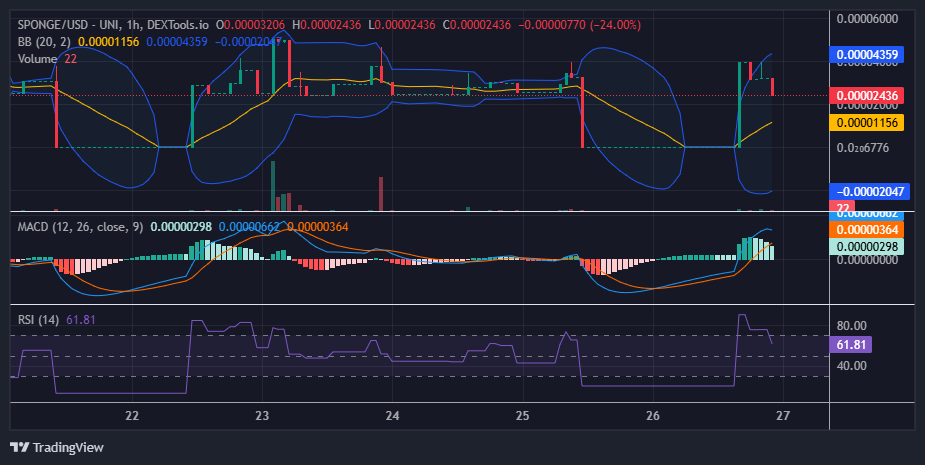
$SPONGE (SPONGE/USD) 1-Hour Chart Insights
In contrast to the converging price channel observed on the 4-hour chart, the 1-hour chart presents a different narrative, with the Bollinger Bands indicating strong divergence and rapid price movements. This heightened volatility is also evident in the RSI, which continues to oscillate between the overbought and oversold zones.
Additionally, while the 20-day moving average had started trending upward, the ongoing correction has caused it to lose momentum. Although the current trading session is marked by a Marubozu bearish candlestick, the market retains the potential for a bounce given the prevailing volatility. Ideally, this bounce should occur before the price of the $SPONGE market descends further to test the 20-day moving average.
Buy SPONGE/USD!
Merry Christmas to all the #SPONGERS around the world 🧽🎄
Now go touch some grass 💦💦 pic.twitter.com/8sPj37mlrK
— $SPONGE (@spongeoneth) December 25, 2024
Join the SPONGE community and be part of the next big crypto sensation! Buy Sponge ($SPONGE) today!