Polkadot (DOT/USDT) Faces Strong Resistance Amid Volatile Market Conditions
Estimated Reading Time: 3 minutes
Don’t invest unless you’re prepared to lose all the money you invest. This is a high-risk investment and you are unlikely to be protected if something goes wrong. Take 2 minutes to learn more
In the last 24h, Polkadot against Tether has shown a modest rebound against the broader market’s 1.87% decline. This appears to have been triggered by increased buying interest, as the momentum oscillator displays a positive outcome after a 16% weekly drop, staking incentives, and a temporary service stop due to migration.
As it stands, the pair on the larger timeframe reveals an ongoing bearish condition, as the shorter chart indicates there might be a recovery soon as the stochastic heads north.
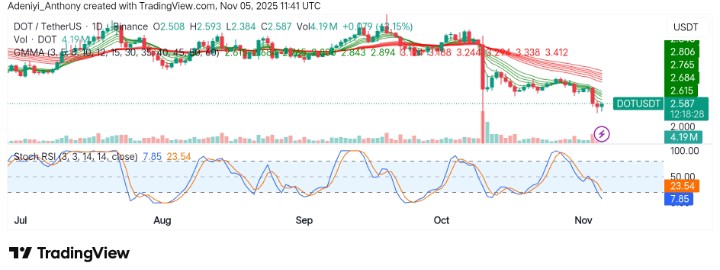
To this end, Polkadot trades at $2.587 with more than 4.19 million traded volumes on the daily timeframe.
Technical Indicators
Major Resistance Levels: $2.760, $2.840, and $3.000
Major Support Levels: $2.550, $2.380, and $2.000
Technical Analysis
On the daily timeframe, Polkadot against Tether is technically in a bearish position as the price operates right down the cluster of the Guppy Multiple Moving Averages (GMMA). Despite the recent uptick in price, the Stochastic RSI (SRSI) suggests the bears are still pulling the price as the lines operate deep into the oversold region.
As it stands, the price seems to be gaining momentum, but without a change in the direction of the momentum oscillator, a break above $2.760 may not be possible. To this end, the direction of the GMMA and the SRSI needs to change before a confirmed uptrend can be recorded.
People don’t understand how strong polkadot $DOT really is. We all witnessed $ZEC crash from its ATH to the lowest and still manage to pick itself back up after years. That same template is playing out again with Polkadot. It’s only a matter of time before the chart recover. pic.twitter.com/cjfAhlP7eh
— CryptoAnkit (@Ankitkal001) October 30, 2025
However, @Ankital001 believes there is a misconception around Polkadot’s price action; comparing the token’s action with $ZEC, the analyst opined that the same template might be playing out.
DOT/USDT Analysis: Can a Rebound be Possible?
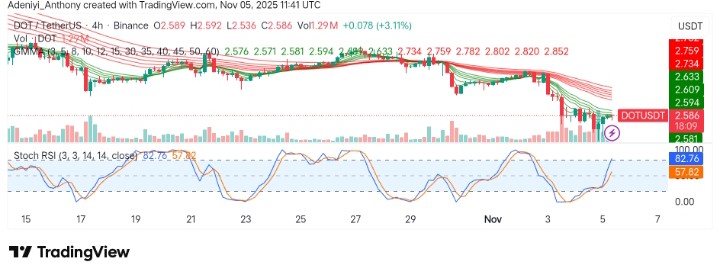
On the 4-hour chart, DOT/USDT appears to be making an attempt at recovery as the price appears to be improving in the previous session. However, it seems a halt has been put to that with the appearance of a bearish candle. Meanwhile, the short-period EMAs seem to be folding for convergence, but the overbought condition of the SRSI signals that the previous actions might be a short-term uptick.
To this end, as the broader market remains weak, a bounce above $2.760 may remain in black and white unless more bullish participation is recorded.
You can purchase crypto coins here. Buy Crypto