Polkadot (DOT/USDT) Testing Key Resistance Lines Falling Momentum
Estimated Reading Time: 3 minutes
Don’t invest unless you’re prepared to lose all the money you invest. This is a high-risk investment and you are unlikely to be protected if something goes wrong. Take 2 minutes to learn more
The market for Polkadot against Tether in the last 24 hours has fallen 2.56%, reacting to Bitcoin dominance as investors shift the capital base away from altcoins.
As it stands, the token has declined below its critical moving averages (statistical lines that smooth out price trends to identify direction), exacerbating downside pressure. Meanwhile, the pair still holds above $3.000 support (a price level where buying interest may prevent further declines), though with no direction, but a surge in bullish participation could change the dynamics.
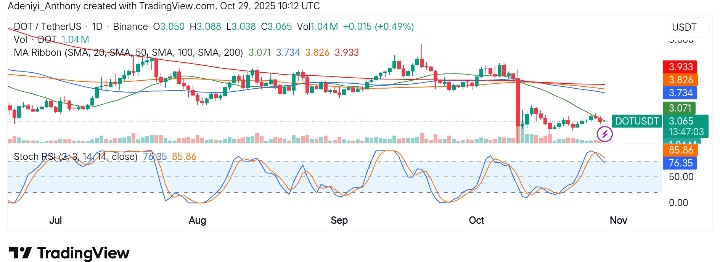
Currently, Polkadot trades at $3.065 with more than 1.04 million volumes for the day.
Technical Indicators
Major Resistance Levels: $3.071, $3.826, and $3.993
Major Support Levels: $3.000, $2.500, and $2.285
Technical Analysis
Technically, Polkadot against Tether appears to be moving sideways, meaning its price is staying within a narrow range without a clear direction. The price continues to hover near a critical dynamic resistance level, which is a moving price barrier that traders watch closely. The market seems to be waiting for a decisive breakout above or below this level.
Currently, Polkadot seems to be struggling to break out of the cluster of moving averages (a group of trend-measuring lines), as the price operates under downward-moving lines. However, it appears that the recent uptick seems to enjoy the support of increasing participation, but the downward-facing Stochastic RSI (a momentum oscillator that measures speed and change of price movements) shows recent gains may erode soon.
To this end, if current momentum is not sustained and the price breaks lower than $3.000, $2.500 may be the next stop before another decisive move.
🔥 Polkadot (DOT/USD) 🇺🇸 — Expected Path on the 4-Hour Timeframe 🔥
Sideways Movement 🔀
* The price has completed five downward waves representing Wave 3, which is part of a larger impulsive structure.
* Currently, the price is moving sideways, suggesting the possibility of… pic.twitter.com/Gtclox8SeW— Elliott Waves Academy (@waves_academy) October 28, 2025
Meanwhile, @Wave_Academy has suggested that wave 4 of the current move would likely head downward, which may be followed by another downward wave with a potential target price of $2.5870 or $2.2848.
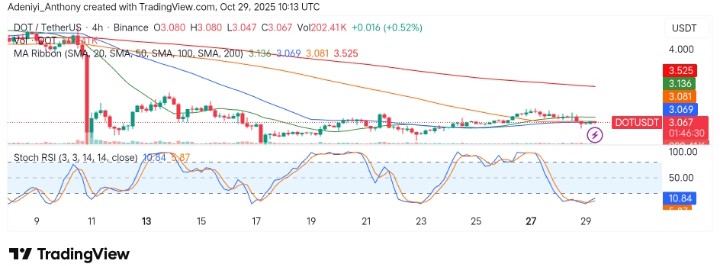
DOT/USDT Analysis: Preparing for Short-Term Bounce
On the 4-hour chart, DOT/USDT appears to be showing signs of a short-term weakness at the moment. However, the Stochastic RSI seems to be significantly oversold, suggesting potential for a bounce.
From another angle, the price seems to be struggling with the moving average ribbon, indicating there may be a move to the south if the price fails to find stronger momentum.
To this end, a dip below $3.000 as seen on the daily timeframe could trigger a further dip. However, a potential bounce could happen if the price manages to hold above $3.070, as the momentum oscillator offers insight into possible bullish divergence.
You can purchase crypto coins here. Buy Crypto