Polkadot (DOT/USDT) Faces Resistance Amidst Declining Momentum: What’s Next?
Estimated Reading Time: 3 minutes
Don’t invest unless you’re prepared to lose all the money you invest. This is a high-risk investment and you are unlikely to be protected if something goes wrong. Take 2 minutes to learn more
The market for Polkadot against Tether in recent times has faced severe dipping below support levels. As it stands, this drop in value has increased market uncertainty even as the price heads south.
At the moment, the pair seems to be struggling with the last line of the bearish indicator, Guppy Multiple Moving Averages (GMMA). However, the Stochastic RSI indicates the buying momentum seems to be increasing.
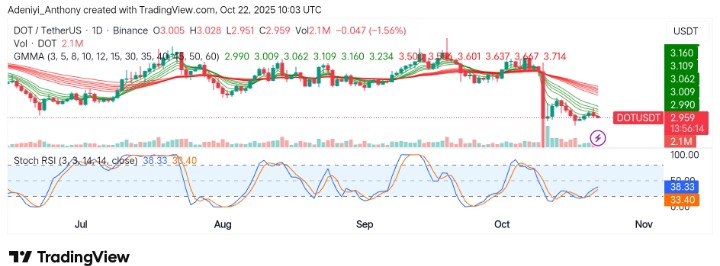
Currently, Polkadot trades at $2.959, recording more than 2.1 million volumes before noon.
Technical Indicators
Major Resistance Levels: $3.009, $3.109, and $3.234
Major Support Levels: $2.410, $1.750, and $1.510
Polkadot Technical Analysis
On the daily timeframe, Polkadot against Tether appears to be declining, with the price moving south with increasing volume, as the GMMA bearishly aligns, indicating the pair could be primed for further downtrend. However, the Stochastic RSI seems to be suggesting otherwise, with the lines displaying the bull may be up to a fresh start from an oversold region.
To this end, Polkadot may record some upside move in the short term, but sustaining such a move would depend on bullish dominance around $3.234 to $4.000; otherwise, a deeper pullback towards $2.000 would surface.
Polkadot News Today
Obviously, Polkadot’s chart has been bearish for a while, even as the price suffered a decline with other coins due to the sell-off that happened not too long ago in the crypto world.
It appears that several waves to the downside have been formed, with more to come. However, to confirm, the price needs to form a lower high before extending presumably 138% to the south. Meanwhile, a move towards $4.95 will cause the token to stay afloat of the sell pressure till bearish pressure subsides in the market.
DOT/USDT Analysis: Can the Price Hold a Bounce?
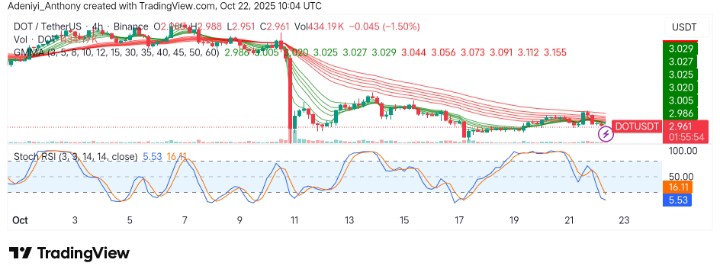
On the 4-hour chart, the Stochastic RSI appears oversold with a potential reversal on the horizon. However, it appears the price is struggling around key resistance as the GMMA appears to be converging.
To this end, a potential rally may be short-lived due to the technicality around the $3.002 resistance level and the broader market. However, if DOT/USDT can break this level, the pair may see a bigger upside move in the near term.
You can purchase crypto coins here. Buy Crypto