Dogecoin (DOGE) Price Prediction: DOGE/USDT Trades Around June’s Low
Estimated Reading Time: 2 minutes
Don’t invest unless you’re prepared to lose all the money you invest. This is a high-risk investment and you are unlikely to be protected if something goes wrong. Take 2 minutes to learn more

Date: November 24, 2025
The Dogecoin market has seen only very minor price increases recently. This has brought the market to trade just around what seems like a six-month low. The market still appears very subdued and retains its vulnerability. Even so, it may only hold short-term gains.
DOGE/USDT Long-Term Trend — Bearish (Daily Chart)
Key Price Levels:
Resistance: $0.1500, $0.1750, $0.2200
Support: $0.1400, $0.1200, $0.1000
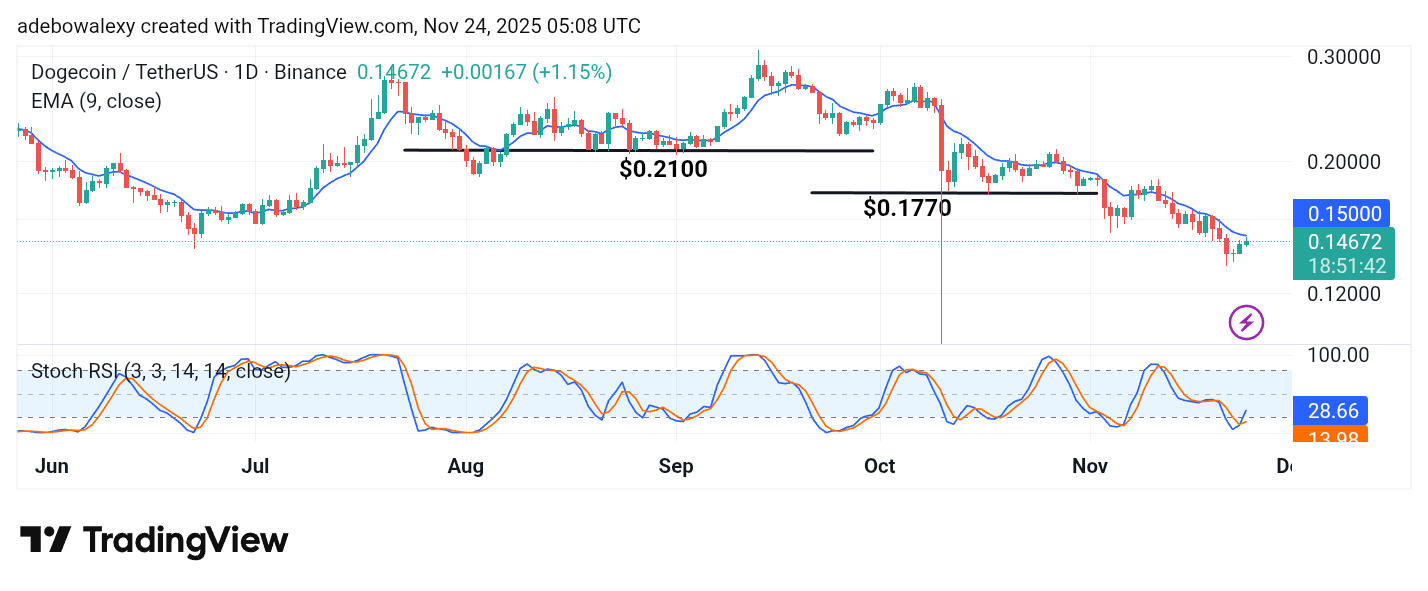
The Dogecoin market has seen a modest upside retracement for two sessions straight on the daily chart. As a result, the last two price candles appear green. However, price action remains below the 9-day Exponential Moving Average (EMA) curve. The lines of the Stochastic Relative Strength Index (SRSI) indicator can also be seen rising upward from the oversold region following an upward crossover.
Dogecoin (DOGE) Price Prediction: DOGE/USDT Presents Short-Term Gains
The ongoing session on the Dogecoin daily chart is bullish. Its appearance suggests a continued upward retracement, although minimal. However, the fact that price remains below the 9-day EMA curve suggests that downward forces are still likely to overcome the short-term trend and cause continued downward correction.
Nevertheless, the SRSI indicator has formed a bullish crossover, and its lines are still rising upward. Therefore, traders can monitor whether price action will break above the 9-day EMA curve.
Dogecoin (DOGE) Price Prediction: DOGE/USDT Consolidates Above the 9-day EMA (4-Hour Chart)
To affirm that bearish forces are still very present in the Dogecoin market, the 4-hour chart shows a consolidating market just above the 9-day EMA curve.
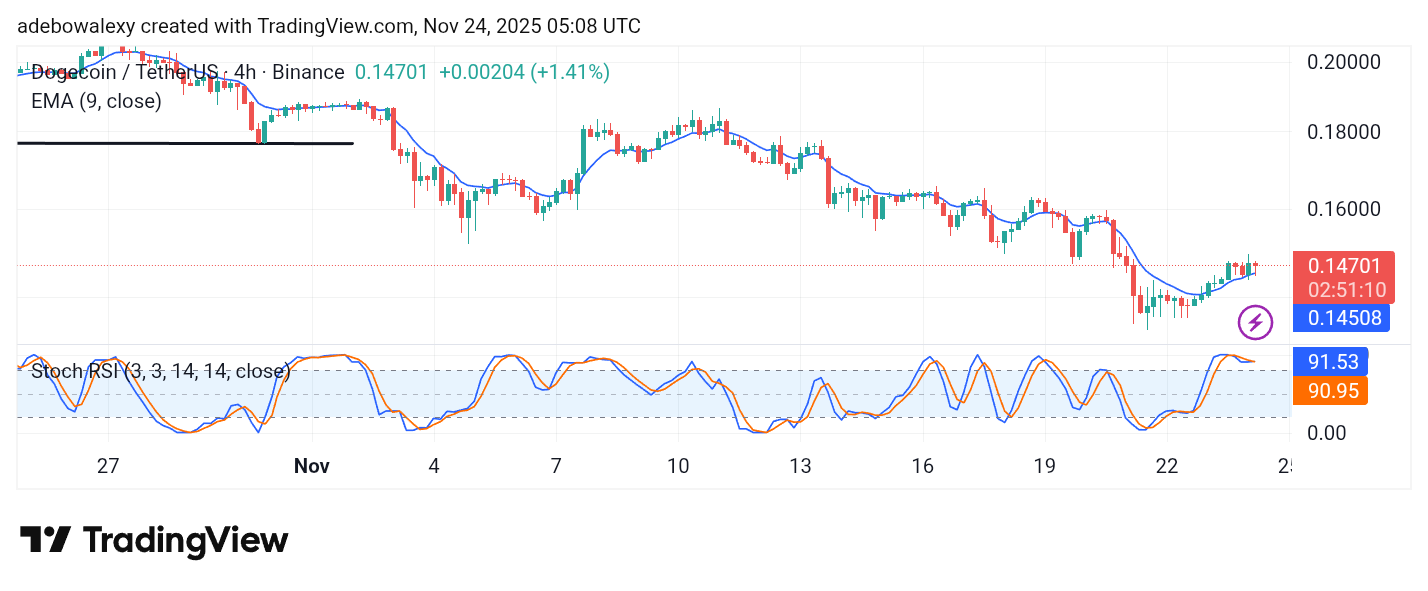
The last price candle on this chart is red but has a slightly upward-contracted body.
At the same time, the SRSI indicator curves are above the 80 mark but have converged following a slight descent toward the 80 level. Therefore, it is technically possible to see an additional upward retracement toward the $0.1600 price level.