The Ondo Market (ONDO/USD) Makes a Splash as it Presses to Cross the $1.00 Price Threshold
Estimated Reading Time: 2 minutes
Don’t invest unless you’re prepared to lose all the money you invest. This is a high-risk investment and you are unlikely to be protected if something goes wrong. Take 2 minutes to learn more
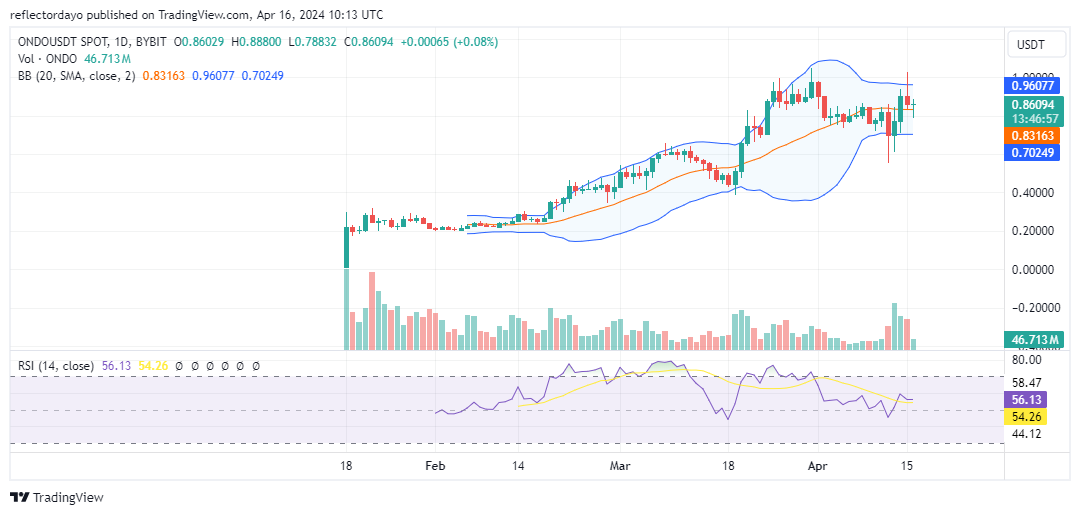
According to the chart utilized for this analysis, the Ondo market debuted on January 18 of the current year, entering at a price of $0.00887. Since then, its performance has been notable, with the market nearing the significant $1.00 price threshold. On March 31, the market approached this level, albeit unsuccessfully, resulting in a bearish turn. Subsequently, on April 12, traders resumed buying activity at $0.700. Yesterday, in the middle of April, the market once more tested the $1.00 level.
The Ondo Market Data
- ONDO/USD Price Now: $0.871
- ONDO/USD Market Cap: $1.2 billion
- ONDO/USD Circulating Supply: 1.4 billion
- ONDO/USD Total Supply: 10 billion
- ONDO/USD CoinMarketCap Ranking: #73
Key Levels
- Resistance: $1.00, $1.50, and $2.00.
- Support: $0.80, $0.75, and $0.70.
The Ondo Market Through the Lens of Indicators
Throughout April, the Ondo market has maintained a sideways trajectory in proximity to the $1.00 price level, lacking clear signals of an imminent breakout above resistance or below support. The Bollinger Bands reflect this sideways movement since the month’s onset, mirroring the price action. Notably, on April 9, the indicator signaled a reduction in volatility, possibly suggesting a consolidation around $0.858. However, recent rapid and robust price swings between yesterday and today indicate a resurgence in volatility. Despite this crypto signal of heightened volatility, neither bullish nor bearish forces have been able to secure a breakout.
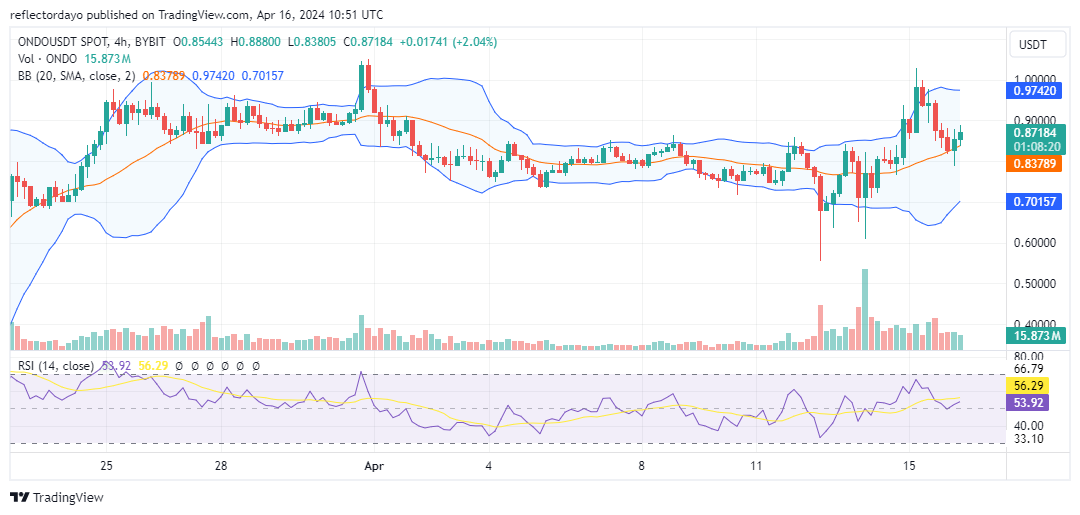
Ondo Price Prediction: 4-Hour Chart Analysis
On a shorter timeframe, volatility appears to be subsiding once more, as neither the bullish nor bearish factions have been able to capitalize on the market’s volatility to their advantage. Consequently, the market may enter another period of consolidation until a catalyst prompts decisive action. Currently, the market resides marginally above the 20-day moving average, and based on the Relative Strength Index, the bulls hold a slight advantage. This suggests that the next breakout may potentially lean towards the upside.