Dogecoin (DOGE) Price Prediction: DOGE/USDT Bearish Sentiment Maintains Lead
Estimated Reading Time: 2 minutes
Don’t invest unless you’re prepared to lose all the money you invest. This is a high-risk investment and you are unlikely to be protected if something goes wrong. Take 2 minutes to learn more

Date: November 17, 2025
The Dogecoin market has been under the activity of headwinds for a while. As a result, price action stays in bearish territory as it presents nothing much of bullish hopes. More details about the market lie below.
DOGE/USDT Long-Term Trend — Bearish (Daily Chart)
Key Price Levels:
Resistance: $0.1900, $0.2100, $0.2300
Support: $0.1800, $0.1600, $0.1400
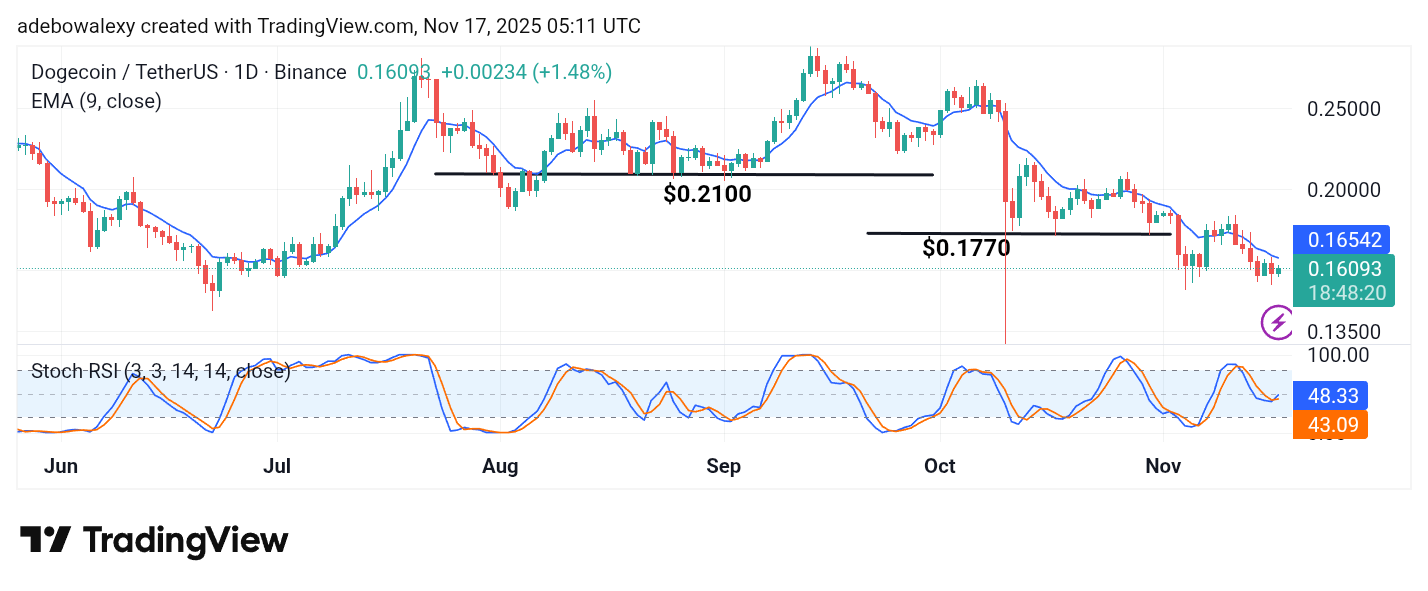
The ongoing session in the daily Dogecoin market has presented only minimal upside price movement. The last price candle on the chart is a green one but has appeared below the 9-day Exponential Moving Average (EMA) curve. Despite this, the Stochastic Relative Strength Index (SRSI) indicator has an upside crossover. The ensuing lines have a clear upward bearing and suggest that the resulting indicator lines may proceed upwards.
Dogecoin (DOGE) Price Prediction: DOGE/USDT Looks Vulnerable Still
The ongoing session in the Dogecoin daily market has arrived bullish. However, the position of the corresponding price candle still suggests that bearish sentiments are quite strong in the market and may dictate future price movement.
But on the contrary, the movement of the SRSI indicator suggests that upside forces are staying active. This arises from the visible upside crossover on the indicator lines and the trajectory of the just ensuing lines of the indicator. This may signal a low entry point just yet.
Dogecoin (DOGE) Price Prediction: DOGE/USDT Upside Movement May Be Resisted (4-Hour Chart)
The Dogecoin 4-hour market has been seeing a modest but continued upward movement. However, as soon as price action made it past the 9-day EMA curve, price action turned bearish.
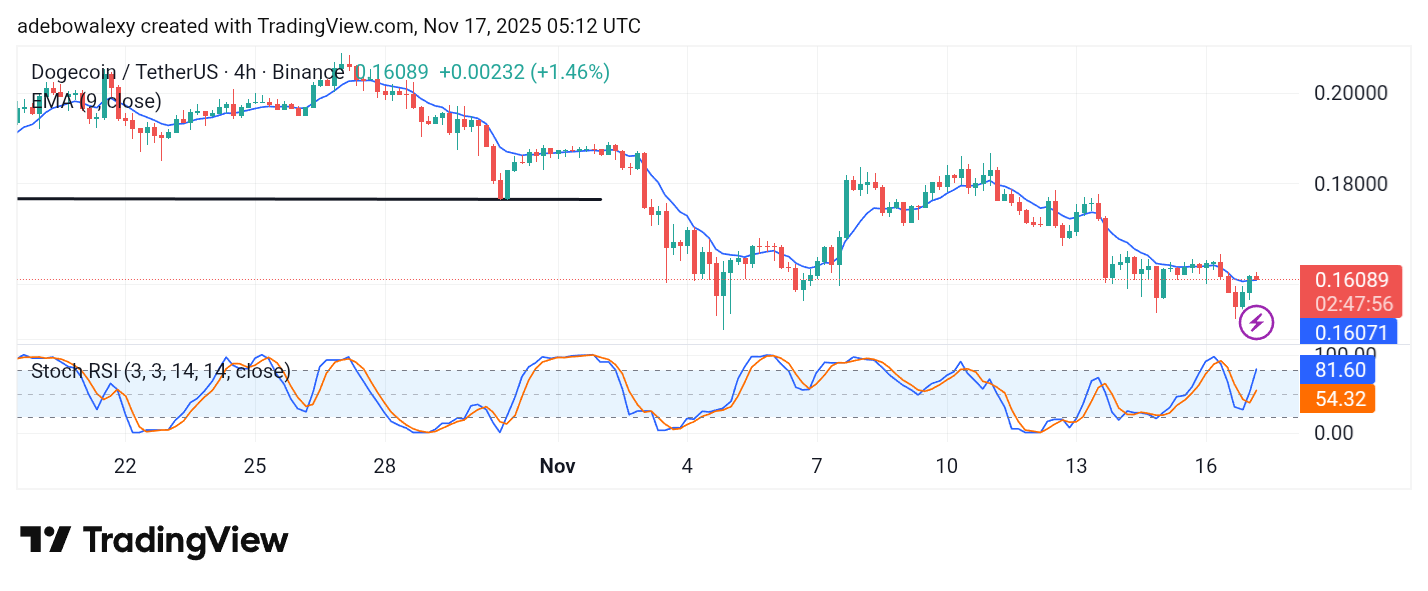
Consequently, this signals that bearish forces are resisting upside movement. Be that as it may, the SRSI indicator stays on its upside trajectory. However, the movement of the indicator lines suggests a weakness in the upside movement. Traders should therefore ensure caution as they target the $0.1700 price level.