Dogecoin (DOGE) Price Prediction: DOGE/USDT Takes Small Steps Toward Recovery
Estimated Reading Time: 3 minutes
Don’t invest unless you’re prepared to lose all the money you invest. This is a high-risk investment and you are unlikely to be protected if something goes wrong. Take 2 minutes to learn more

Date: November 10, 2025
Following a price dip below a multi-month support level, buyers are beginning to re-enter the market. This has resulted in a modest upside retracement so far. However, further upward movement may still be seen in the market over subsequent sessions.
DOGE/USDT Long-Term Trend — Bullish (Daily Chart)
Key Price Levels:
Resistance: $0.1900, $0.2100, $0.2300
Support: $0.1800, $0.1600, $0.1400
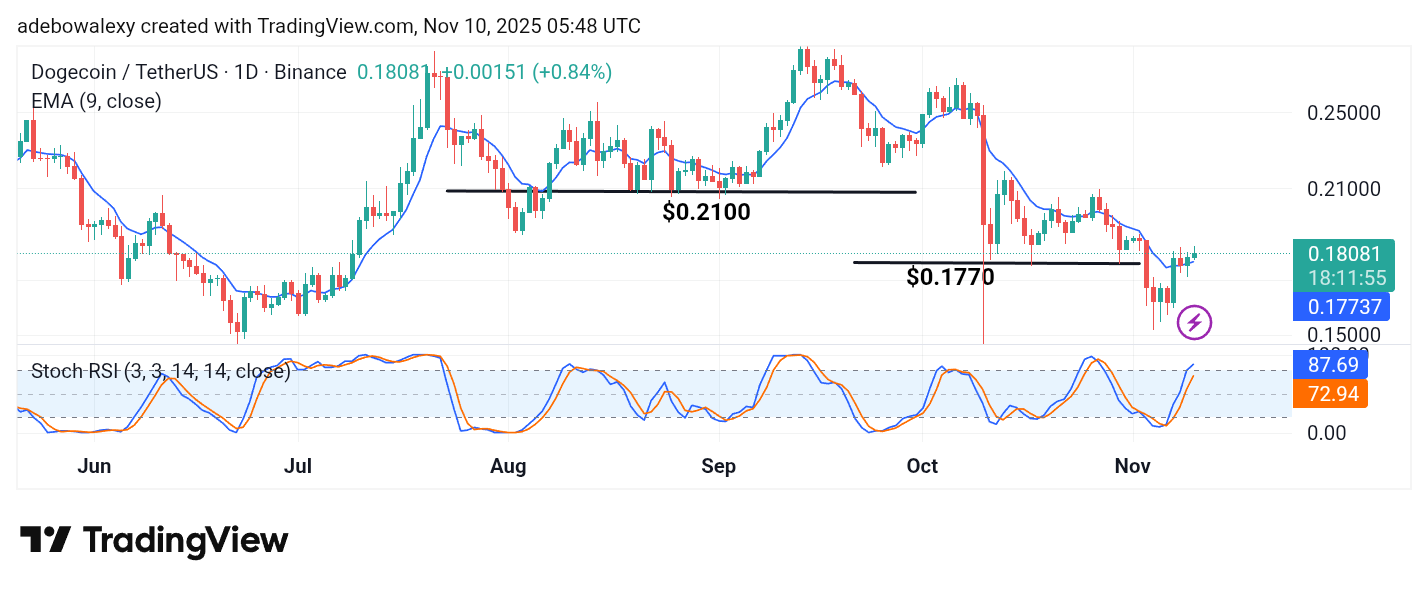
The last price candle above the 9-day Exponential Moving Average (EMA) on the Dogecoin daily chart is a bullish one. Through this candle, it can be seen that price action is taking off from the 9-day EMA curve. Meanwhile, the Stochastic Relative Strength Index (SRSI) indicator lines are now appearing above the 80 mark. It is worth noting that the lead line of this indicator shows a slight deflection.
Dogecoin (DOGE) Price Prediction: DOGE/USDT Maintains a Bullish Course
With price activity in the Dogecoin market now appearing above the 9-day EMA curve, there seems to be room for further price growth. The current session shows that price movement is lifting off from the 9-day EMA, suggesting that bulls may gain more traction in the coming sessions.
The lines of the SRSI indicator are in the overbought region, with the lead line positioned above the 80 mark. The lead line shows a slight deflection, possibly due to modest contraction during the session. Nevertheless, upside forces still appear dominant, suggesting that bullish momentum may continue.
Dogecoin (DOGE) Price Prediction: DOGE/USDT Stays Afloat Despite Bearish Influences (4-Hour Chart)
On the Dogecoin 4-hour price chart, price action remains above the 9-day EMA curve. This holds true despite the bearish appearance of the current session’s price candle, which still stands at a distance above the 9-day EMA.
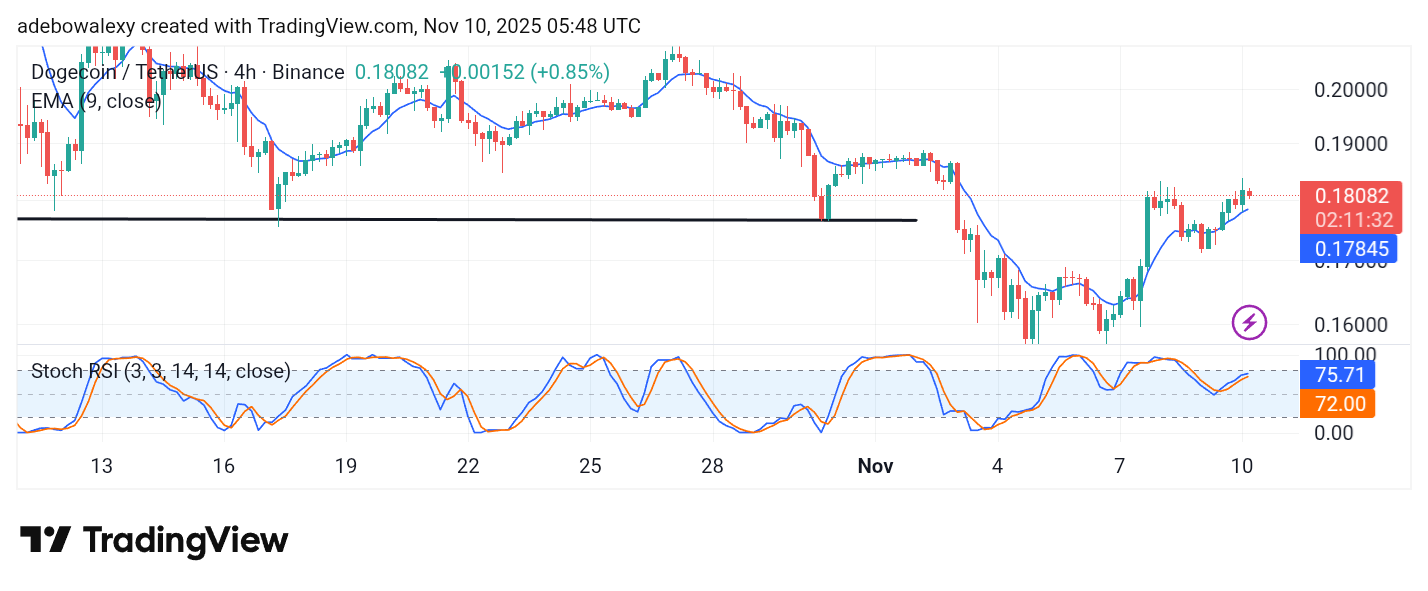
Similarly, the SRSI indicator lines maintain a general upward trajectory despite the temporary pullback observed in the ongoing session. However, the lead line of the SRSI shows a slight downward deflection toward a possible crossover below the 80 mark.
Even so, the market still retains bullish potential, with price likely to push toward the $0.1900 level in the short term.