Dogecoin (DOGE) Price Prediction: DOGE/USDT Bears Breach a Month-Old Support Level
Estimated Reading Time: 3 minutes
Don’t invest unless you’re prepared to lose all the money you invest. This is a high-risk investment and you are unlikely to be protected if something goes wrong. Take 2 minutes to learn more

Date: November 3, 2025
As the Bitcoin market takes another dip below the $108,000 price level, the Dogecoin market responds in a way that suggests a continued bearish trend. As a result, the price of the token has fallen below a month-old support level, which may prove crucial for this market.
DOGE/USDT Long-Term Trend — Bearish (Daily Chart)
Key Price Levels:
Resistance: $0.1800, $0.2000, $0.2250
Support: $0.1700, $0.1500, $0.1300
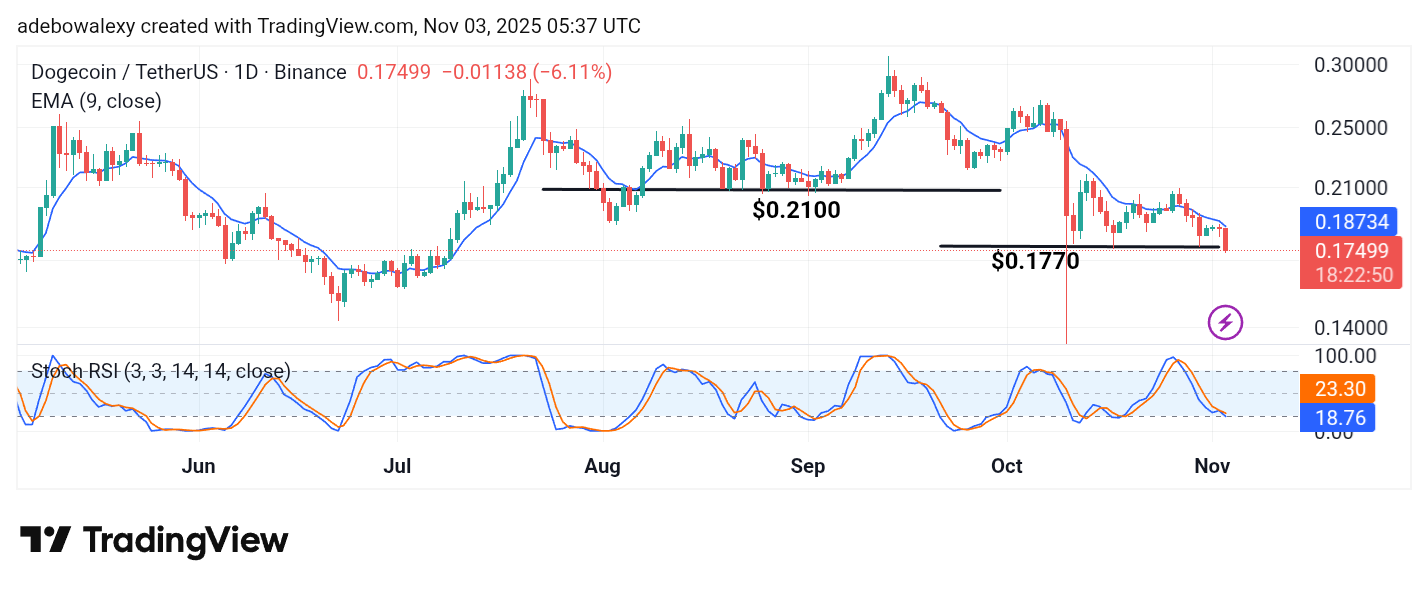
The ongoing session has presented a notable price drop, as shown by the appearance of the last price candle on the chart. Consequently, prices have descended further below the 9-day Exponential Moving Average (EMA) line. The price of Dogecoin, as of the time of writing, was $0.17499 — below the one-month-old support at $0.1770. The lines of the Stochastic Relative Strength Index (SRSI) indicator can be seen moving deep into the oversold zone following a short-lived upside crossover.
Dogecoin (DOGE) Price Prediction: DOGE/USDT May Continue Its Bearish Course
On the daily chart, Dogecoin has experienced increased bearish momentum, as revealed by the ongoing session. With price action positioned significantly below the 9-day EMA curve, downward forces are clearly dominating trader sentiment.
The size of the last price candle on the chart reflects increased volatility in the market. In addition, the trajectory of the SRSI indicator lines further reinforces bearish sentiment, as previous bullish attempts have failed. At this point, traders are likely to take more short-term short positions in this market.
Dogecoin (DOGE) Price Prediction: DOGE/USDT Bears Face a Struggle (4-Hour Chart)
While the overall bearish trend remains, price action on Dogecoin’s 4-hour chart appears to have entered a period of indecision among market participants.
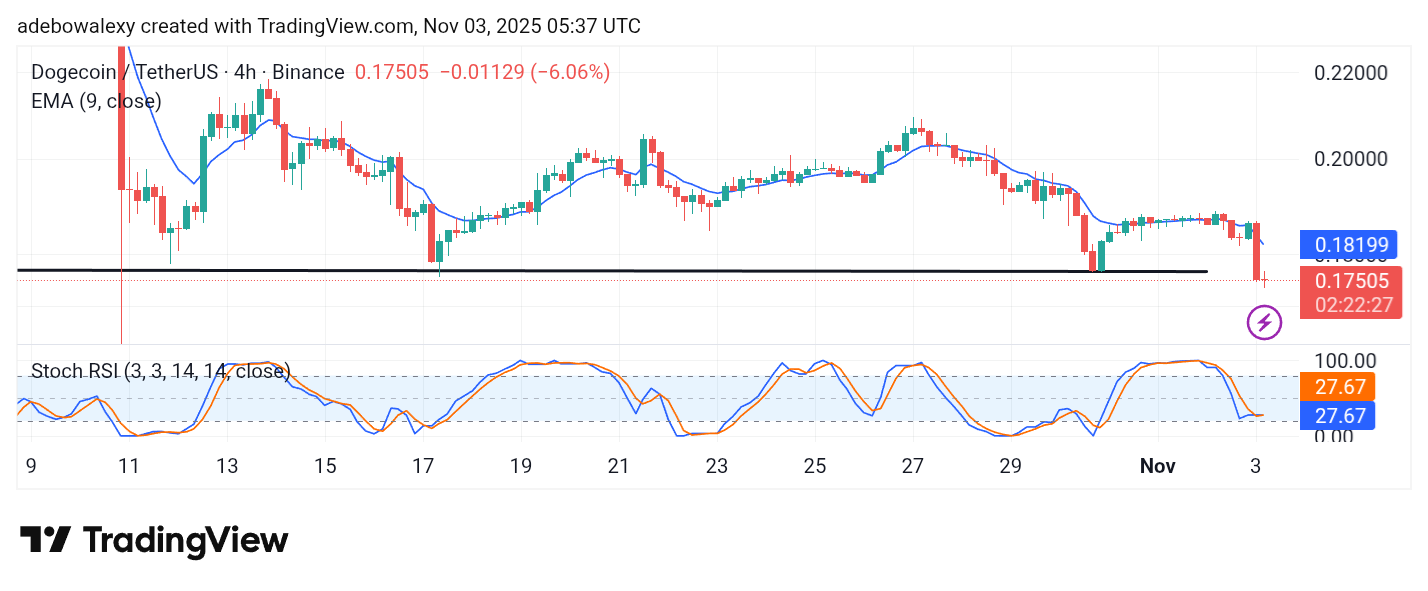
The price candle corresponding to the ongoing session has appeared as a red spinning-top candle, suggesting that traders are weighing their options on whether to enter the market at this point or continue with the existing trend.
Nevertheless, price action remains below the 9-day EMA. The lines of the SRSI indicator are merged and pointed sideways. As such, traders may want to stay on the sidelines until the market establishes a short-term direction — either toward the $0.2000 resistance level or down to the $0.1500 support level.
Get Dogecoin (DOGE) here. Buy DOGE
