Uniswap (UNI/USD) Market Is Less Beefy Below $6
Estimated Reading Time: 3 minutes
Don’t invest unless you’re prepared to lose all the money you invest. This is a high-risk investment and you are unlikely to be protected if something goes wrong. Take 2 minutes to learn more
Uniswap Price Prediction – January 11
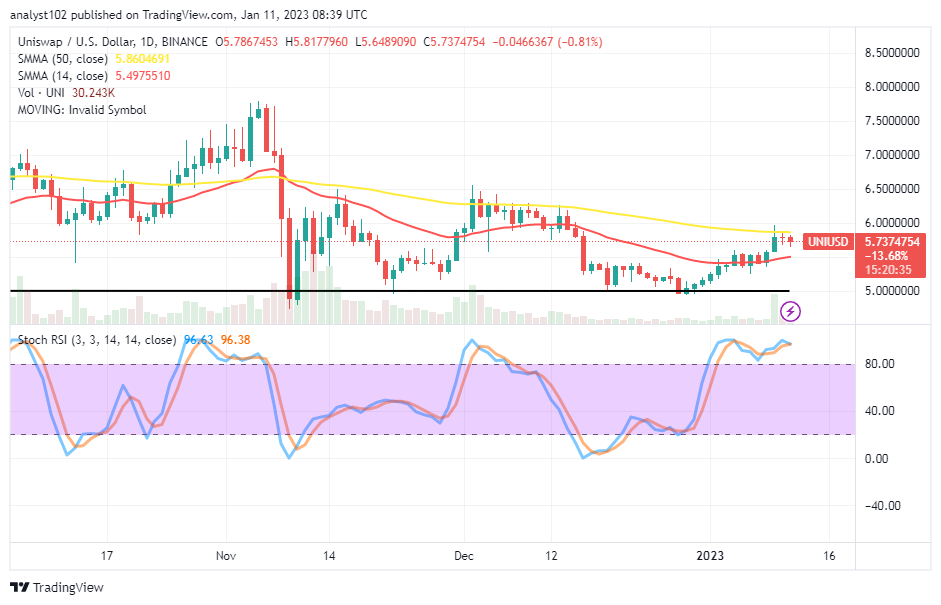
Many opposing-barrier signs are remained to pile up ahead of northward forces as the UNI/USD market is less beefy below the $6 resistance line. The pressure from business operations indicates that the US Dollar is gaining a stance at an average minute percentage rate of 0.81. As of this writing, the price is trading at $5.7374754.
UNI/USD Market
Key Levels:
Resistance levels: $6, $6.50, $7
Support levels: $5, $4.50, $4
UNI/USD – Daily Chart
On the showcasing not of today’s UNI/USD daily chart, the crypto market is less beefy below the $6 resistance level, where the bigger SMA portends a hard-to-be-broken revolting line over time. The 14-day SMA indicator is at $5.4975510, underneath the $5.8604691 value line of the 50-day SMA indicator. The Stochastic Oscillators are in the overbought region, making a second-term approach to indicate excessiveness has cropped up in the wake of upsurges.
Will the UNI/USD market bears retake control of company activities shortly?
Taking the capacity pace the UNI/USD trade currently pushes into consideration, the crypto economy appears, losing momentum as its valuation is less beefy below the $6 resistance level. Every indication has it that long-position placers won’t have a better move to outweigh the positions of bears in the subsequent volatile runs, especially while a rising motion tends to test a point around the resistance-trading spot of the market line in question afterward.
On the depreciation side of the technical analysis, buying activities in the crypto operations have worn a look worthy of retracing as there has been an emergence of a smaller bearish candlestick in the making to suggest a decline is imminent. Sellers must be mindful of a move attempting to break past a value barrier between $6 and $6.50. A powerful falling force may not be forthcoming to establish a clear-cut toward getting a profiteering condition in that presumption.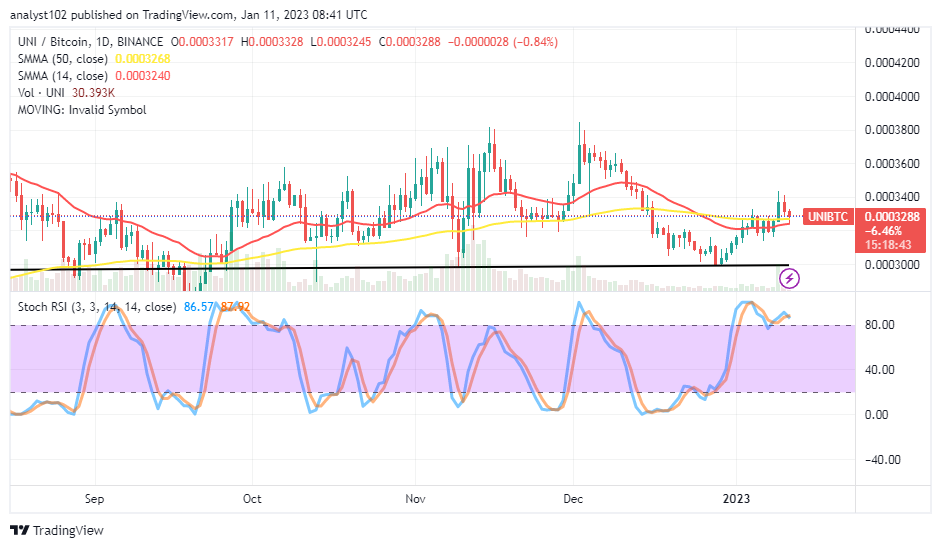
UNI/BTC Price Analysis
In comparison, a line of about three candlesticks has shown that Uniswap’s trending ability has resorted to a less beefy motion closely over the trend lines of the SMAs. The 14-day SMA indicator is underneath the 50-day SMA indicator. The Stochastic Oscillators are in the overbought region, trying to make an effort to cross their lines southbound at 87.92 and 86.57 levels. That implies the base crypto may debase briefly for a while against its counter-trading crypto before resuming a round of rallying motion.
Note: Cryptosignals.org is not a financial advisor. Do your research before investing your funds in any financial asset or presented product or event. We are not responsible for your investing results.
You can purchase Lucky Block here. Buy LBLOCK