Wall Street Memes (WSM) Price Moves On, Buyers Are Steady
Estimated Reading Time: 3 minutes
Don’t invest unless you’re prepared to lose all the money you invest. This is a high-risk investment and you are unlikely to be protected if something goes wrong. Take 2 minutes to learn more
Wall Street Memes Price Prediction – August 21
Day by day it has been continually showcased that pull-downs that have been attempted by the WSM/USD market sellers are on the note of decreasing, as the crypto-economic price moves on a tangible threshold zone, making buyers to be steady.
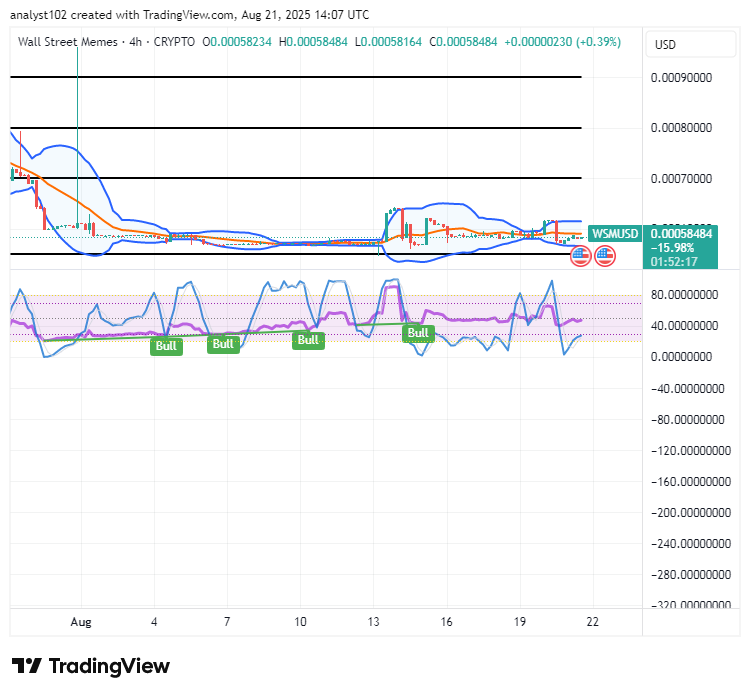
The Wall Street Memes market is still made to thrive in mood of thriving in sideways by re-occurring positions staking styles, basically, around the eastward-stretching of the lower Bollinger Band indicator marked closely at the top side of the $0.0005 support.
WSM/USD Market
Key Levels
Resistance levels: $0.0007, $0.0008, $0.0009
Support levels: $0.0005, $0.0004, $0.0003
WSM/USD – 4-hour Chart
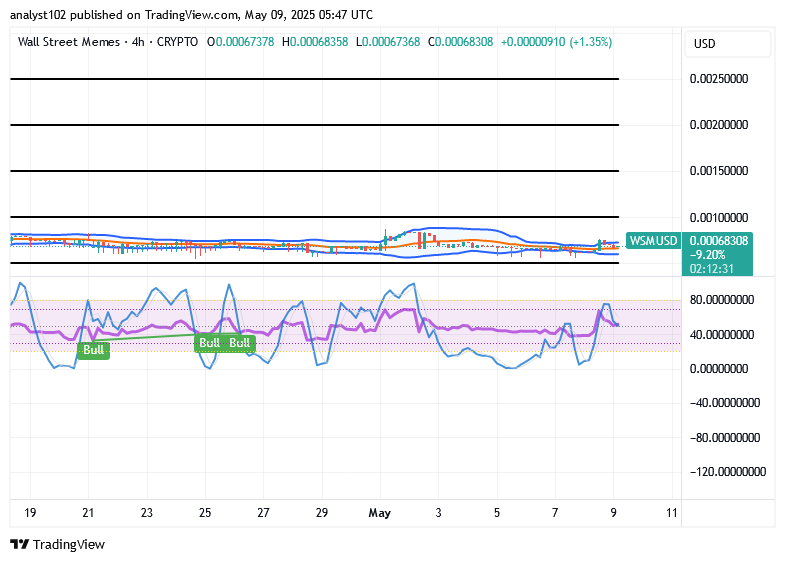
The market’s medium-term chart of WSM/USD showcases that the crypto-economic market moves on a baseline, as buyers stay steady.
The stochastic oscillators have stepped southbound into the oversold region, signaling that a motion to the reduction path is on the verge of slowing down. The Bollinger Bands are a bit opening in sideways pattern around $0.0006 values.
Does the medium-term WSM/USD chart suggest baseline stability as buyers maintain steady positions?
The WSM/USD trade chart reflects steady stability with consistent buyer demand, a reliability that strengthens long-term investments, reinforces investor confidence, and signals promising prospects for continued market growth.
The WSM/USD trade chart signals encouraging baseline stability, with buyers maintaining steady momentum. This consistency strengthens long-term position stakes, highlighting investor confidence and suggesting sustained upward growth potential within the broader crypto-economic market structure.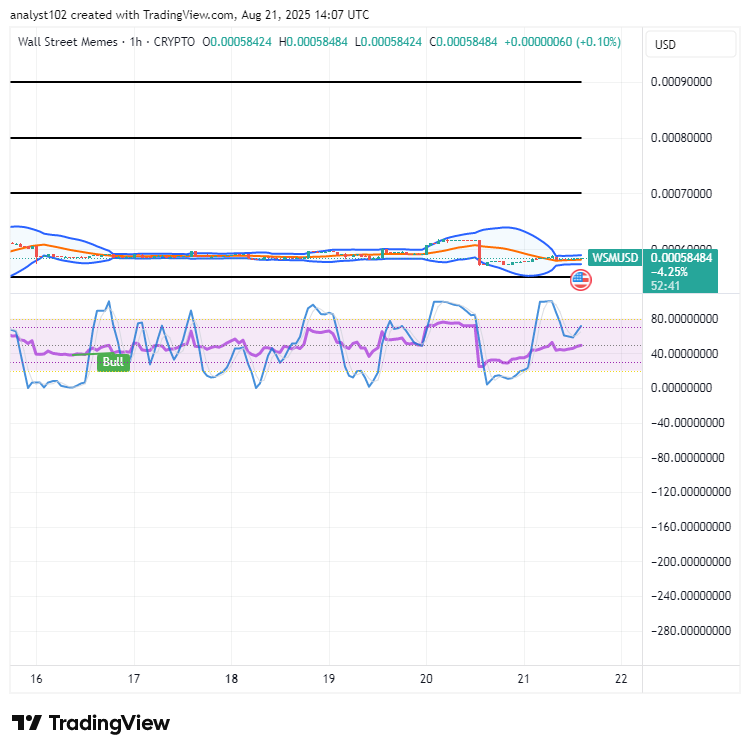
WSM/USD 1-hour chart
The 1-hour chart of the WSM/USD market moves on a firmly established baseline above $0.0005, as buyers are steady.
The stochastic oscillators have been persistently swinging up and down while holding near the threshold of buying signals, thereby strengthening bullish entry confirmations for traders. The Bollinger Bands are stretching closely around $0.0006, reflecting tightening market consolidation phases and supporting potential upward breakouts.
WSM/USDT is now officially tradeable on #Bybit Perpetuals for global users.
Trade here: [https://i.bybit.com/1Wab4K3z](https://i.bybit.com/1Wab4K3z)
Also want your project listed soon? Share your valuable suggestions here:
$WSM community, we saw your Tweets! 👏$WSM / $USDT is now tradeable on #Bybit Perpetuals.
— Bybit (@Bybit_Official) October 13, 2023
Trade here: https://t.co/le4XyVyXaZ
Also want your project listed? Share your suggestions here:https://t.co/W7EWJVVNV5 https://t.co/XgXoL7g0rF