Wall Street Memes (WSM/USD) Trade Volumes Up, Setting Hikes
Estimated Reading Time: 3 minutes
Don’t invest unless you’re prepared to lose all the money you invest. This is a high-risk investment and you are unlikely to be protected if something goes wrong. Take 2 minutes to learn more
Wall Street Memes Price Prediction – May 9
As continual proceedings have marked the presence of both buyers and sellers in the operations of the Wall Street Memes coin against the US dollar, position staking has been systematically on the rise, anticipating a potential breakout from within the current trading range, given the rising crypto-economic trade volumes.
The broader trend structure clearly supports bullish re-accumulation on pullbacks, with market behavior consistently validating long-entry opportunities during dips below current value ranges. These zones have repeatedly acted as high-probability accumulation levels, reinforcing the upward bias in the pairing market. Momentum indicators continue to align with this bullish outlook, suggesting strength in underlying demand. While some short-term consolidation may persist, sellers should remain cautious, as technical patterns overwhelmingly lean toward accumulation rather than a sustained bearish breakdown.
WSM/USD Market
Key Levels
Resistance levels: $0.001, $0.0015, $0.002
Support levels: $0.0005, $0.0004, $0.0003
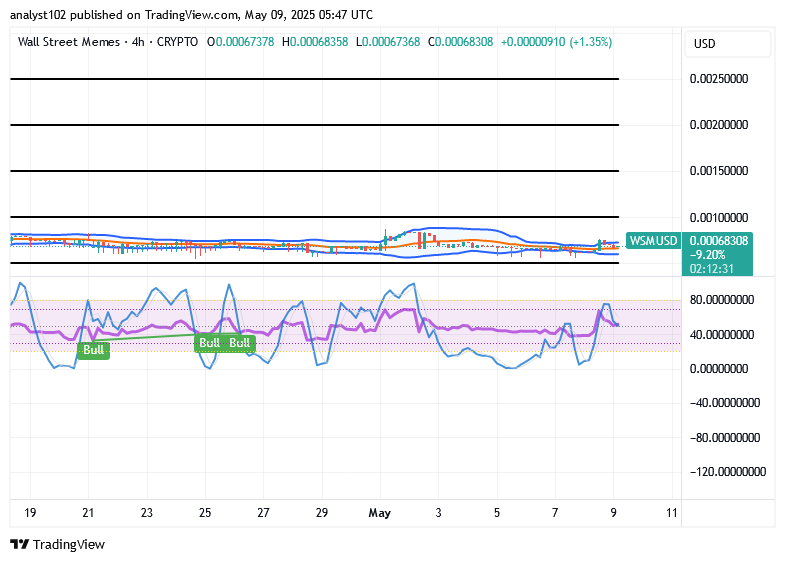
WSM/USD – 4-hour Chart
The WSM/USD 4-hour chart indicates that the crypto-economic trade volumes are up, eyeing a breakout in the business proceedings.
The stochastic oscillators maintain a declining slope deep within the oversold quadrant, reinforcing the likelihood of a near-term bullish pivot and presenting a technically favorable zone for strategic long exposure. Concurrently, the Bollinger Bands exhibit intensified lateral divergence, sustaining a compression phase bounded by the $0.0005 to $0.001 thresholds.
Will WSM/USD market surpass key thresholds amid growing opportunity?
Expectation to see the WSM/USD market surpassing key thresholds amid growing opportunity will be massively exposed to a huge loss while the crypto’s economy steps up its muscles aggressively, given that the price volumes are up, eyeing breakout in no time.
Given the current structure, it appears that the WSM/USD market’s downside activity is nearing exhaustion, potentially paving the way for sharp rebounds and trend reversals in the near term. With bearish momentum weakening, investor sentiment shows signs of recovery, confidence in accumulation phases is rising, and early positioning may reward patience as bullish catalysts begin to take shape.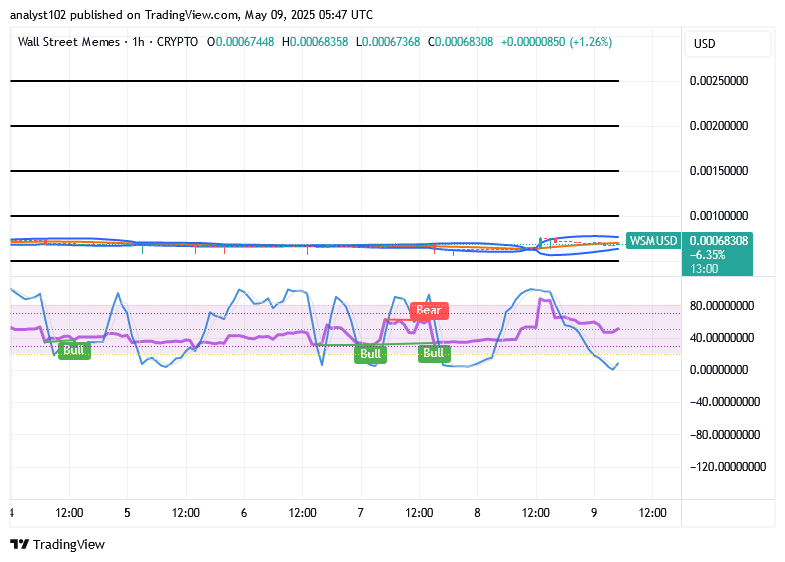
WSM/USD 1-hour chart
The 1-hour chart depictures it that the WSM/USD trade volumes are up, eyeing a breakout in the operational dealings.
The Bollinger Bands indicate strengthening buying activity, as market participants explore multiple re-entry points amid heightened volatility. The stochastic oscillators have dipped into the oversold zone, suggesting that selling momentum may be tapering off, thereby increasing the probability of a near-term reversal.
Stake Now for Early Yield Access ➡️ https://wallstmemes.com/en/dashboard
Buy Now to Secure Entry Levels ➡️ https://wallstmemes.com
🔥 Up To 44% APY Now Available 🔥
— Wall Street Memes (@wallstmemes) October 6, 2023
Stake Now ➡️ https://t.co/X031FQo0bW
Buy Now ➡️ https://t.co/kNJqZfssBZ pic.twitter.com/oQ6sKXJpcL