Wall Street Memes (WSM/USD) Price Is Undervalued, Set to Climb
Estimated Reading Time: 3 minutes
Don’t invest unless you’re prepared to lose all the money you invest. This is a high-risk investment and you are unlikely to be protected if something goes wrong. Take 2 minutes to learn more
Wall Street Memes Price Prediction – May 8
More attractions have been drawn to efforts that are likely going to produce a formidable rebounding threshold for long-term position movers in the wake of the Wall Street Memes coin finding an all-time low valuation against the US dollar, as the base instrument remains undervalued, set to climb in no time.
Historically, i.e., technically, each dip below the current value range in the pairing market has consistently yielded high-probability entry points for long-term accumulation. While the broader trend structure favors bullish re-accumulation on pullbacks, sellers should exercise caution when initiating new positions within consolidation zones, as the technical bias tends to favor accumulation over sustained bearish continuation.
WSM/USD Market
Key Levels
Resistance levels: $0.001, $0.0015, $0.002
Support levels: $0.0005, $0.0004, $0.0003
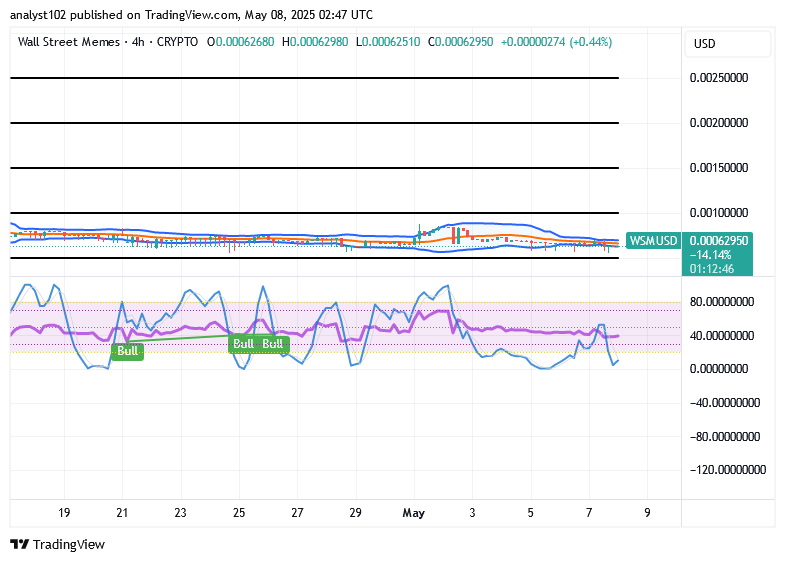
WSM/USD – 4-hour Chart
The WSM/USD 4-hour chart indicates that the crypto asset is undervalued and poised to climb, with upward momentum expected to begin shortly.
Bollinger Bands continue to exhibit pronounced eastward expansion, maintaining a range-bound structure between the $0.001 and $0.0005 price levels. Meanwhile, the stochastic oscillators remain on a downward trajectory within the oversold territory, reinforcing the probability of an imminent bullish reversal and signaling a favorable window for initiating long entries.
Will WSM/USD break $0.001 or $0.0005 as volatility rises?
We do not attach more reliable sentiments to executing shorting orders in the activities of Wall Street Memes coin as being paired with the valuation of the American currency regardless of how long that there’ll be journey to the south side, given that the crypto’s stance is yet undervalued, and optimistically set to climb in the near time.
Being as it is, it appears that the WSM/USD market operations to the negative direction is vastly approaching an end, potentially giving way to sudden bounces and market reversals that may occur in the near future.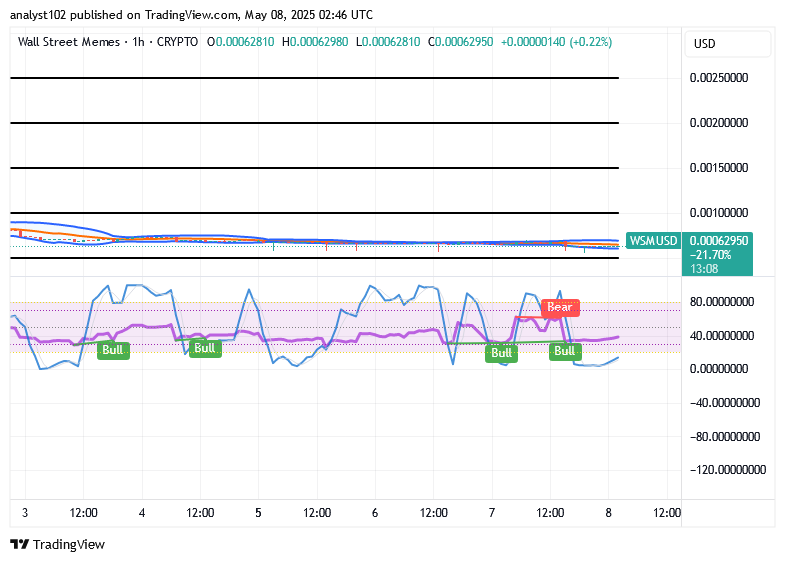
WSM/USD 1-hour chart
The 1-hour chart showcases that the WSM/USD market is undervalued floating above $0.0005, set to climb potentially in no time.
The stochastic oscillators have retraced southward into the oversold zone, signaling a diminishing momentum in selling pressure at the lower extremes. Simultaneously, the emergence of relatively small-bodied candlesticks near the lower trend line of the Bollinger Bands indicates that buying activity is intensifying, with market participants attempting multiple re-entry points, in an effort to reverse the prevailing downtrend.
Take Action and Stake Now ➡️ https://wallstmemes.com/en/dashboard
🔥 Up To 45% APY Now Available 🔥
— Wall Street Memes (@wallstmemes) October 5, 2023
Stake Now ➡️ https://t.co/tb6DMwvNQx pic.twitter.com/qaqMQD2cjT