Wall Street Memes (WSM) Price Remodels, Making Bounce Moves
Estimated Reading Time: 3 minutes
Don’t invest unless you’re prepared to lose all the money you invest. This is a high-risk investment and you are unlikely to be protected if something goes wrong. Take 2 minutes to learn more
Wall Street Memes Price Prediction –May 7
Variant lower lows and lower highs have continually to surface between $0.001 and $0.0005 in the mode of generating waves toward securing ideal all-time low point ahead of stable rallying force, as the WSMS/USD market remodels its stances, making bounce moves in its setup so far.
The current trade setup suggests potential consolidation phase or price stagnation within the $0.001 to $0.0005 range, preceding any meaningful resumption of bullish momentum. Upon completion of this accumulation period, the likelihood of new impulsive upward leg increases, contingent upon a sustained breakout above the prevailing resistance trend line—signaling renewed strength as the bullish market structure reasserts itself.
WSM/USD Market
Key Levels
Resistance levels: $0.002, $0.0025, $0.003
Support levels: $0.0008, $0.0006, $0.0004
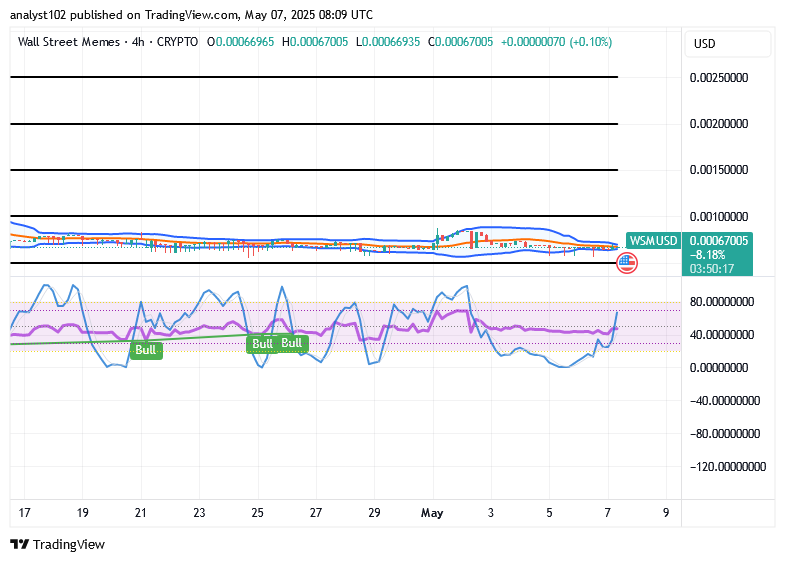
WSM/USD – 4-hour Chart
The WSM/USD market’s 4-hour chart shows that the crypto-economic market is adjusting its positions, making bounce moves in its current setup.
The Bollinger Bands’ trend lines are currently positioned eastward between $0.0001 and $0.0005. The stochastic oscillators have dipped southward, entering the oversold region, following a prolonged bullish signal.
With WSM/USD testing the lower Bollinger Band, does the setup justify continued accumulation by buyers?
Position staking proceeds have to continue as the WSM/USD market operations are yet optimistically in the processes of catalysts-recouping pattern, just as the current trading condition shows that the base instrument remodels its stances, making bounces in its trade outlooks.
The price range between $0.001 and $0.0005 is shaping up as a strong support zone, offering a solid foundation for potential bullish recovery. While the bearish pressure could persist as traders seek catalysts for further downside, maintaining long positions—especially at current levels—remains a prudent strategy in anticipation of a forthcoming rebound. Vigilance is advised, however, as short-term volatility may present opportunities for strategic adjustments.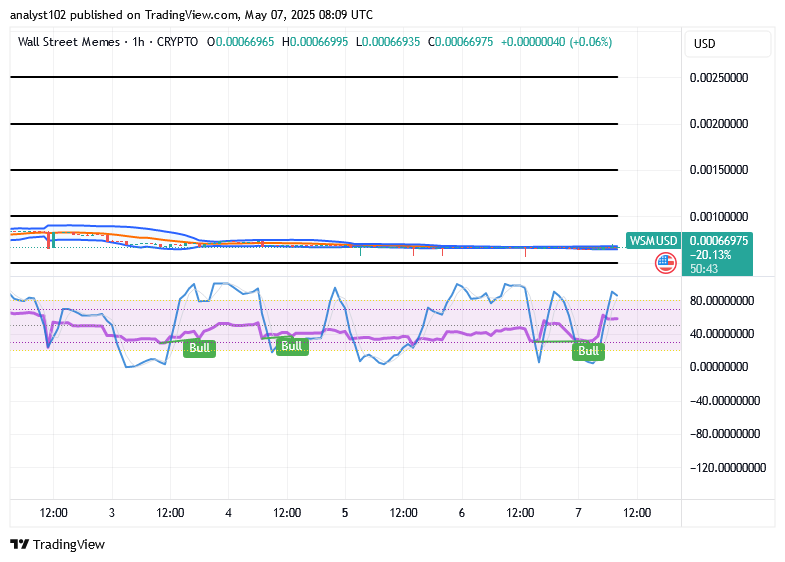
WSM/USD 1-hour chart
The 1-hour chart, based on the short-term technical setup, indicates that the WSM/USD market is adjusting its structure, making bounce moves in the current formation.
The stochastic oscillators have turned northward into the overbought zone, maintaining a bullish signal. Meanwhile, the Bollinger Bands are gradually expanding in a horizontal alignment, indicating consolidation near a key trading zone just above the critical support level of $0.0005.
🚀 BIGTIMEUSDT & WSMUSDT Perpetual Contracts are now live on Bybit!
Trade with leverage, tight spreads, deep liquidity, real-time execution & advanced risk controls — all on a high-performance derivatives platform.
🚀 BIGTIMEUSDT & WSMUSDT Contracts now on Bybit!
— Bybit (@Bybit_Official) October 12, 2023
Dive into new trading opportunities with 1-25x leverage. Plus, they’re now on Bybit Futures Grid Bot! Start trading now.
📈 BIGTIME: https://t.co/FAQlbhnzAh
📈 WSM: https://t.co/pb2y2AfMBE#CryptoTrading #Bybit