Wall Street Memes (WSM) Market Retunes, Refreshing Momentum
Estimated Reading Time: 3 minutes
Don’t invest unless you’re prepared to lose all the money you invest. This is a high-risk investment and you are unlikely to be protected if something goes wrong. Take 2 minutes to learn more

Wall Street Memes Price Prediction – May 6
In yet another trading day, evidence continues to build that long-term positive position holders are on the verge of firmly establishing a baseline, indicating that the WSM/USD market is retuning its posture and refreshing momentum.
The $0.001 market line remains a crucial barrier level, with buyers and investors left to consider recovery opportunities from the lower end. The current bargaining conditions suggest that this zone represents another compressed trading range, offering a strategic opportunity to rebuild positions and potentially propel a swift move to the upside.
WSM/USD Market
Key Levels
Resistance levels: $0.001, $0.0015, $0.002
Support levels: $0.0005, $0.0004, $0.0003
WSM/USD – 4-hour Chart
The medium-term chart (4-hour chart) of the WSM/USD market now reveals that the crypto-economic market retunes in its positioning settings, refreshing momentum.
The Bollinger Bands have been steadily extending sideways, with a gradual widening observed between the $0.001 and $0.0005 levels. Most of the price action within recent market operations appears to be forming ideal long-entry setups, as the stochastic oscillators swing in the oversold region—indicating that downward momentum is weakening and the velocity of further bearish moves is tapering off.
Is it reasonable to pursue downside moves during consolidation, given that WSM/USD oscillators are currently in oversold territory?
We do not technically recommend pursuing further downside moves, given that the WSM/USD market is currently consolidating in the oversold region. This phase suggests that the crypto-economic trade is realigning its structure and refreshing momentum
The overall technical configuration of the indicators suggests that the prevailing downward pressure is fostering structurally favorable conditions for strategic long entries. This setup not only enhances the risk-reward profile for patient investors but also reflects growing internal market resilience. Accordingly, maintaining long-term positioning remains a prudent approach, as the base market shows potential for appreciable recovery—even if the counter instrument experiences temporary depreciation—signaling underlying strength and long-horizon value accumulation.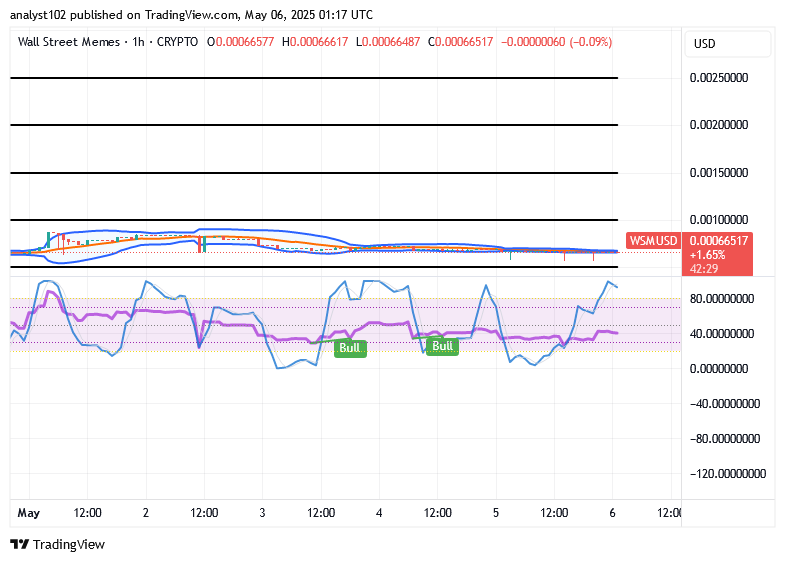
WSM/USD 1-hour chart
The 1-hour chart from the technical arrangements of the WSM/USD trade showcases that the price retunes, refreshing momentum.
The conjoining positional setup of the Bollinger Bands around $0.00066517 is a demonstration that traders are taking time to decide next directional movement for clarity. A momentary negative signal note is tentatively revealing that buyers may still be checkmated for a while against securing ideal resumption of rallying forces.
$WSM / $USDT is now officially tradeable on #Bybit Perpetuals with increased market access.
$WSM community, we saw your Tweets! 👏$WSM / $USDT is now tradeable on #Bybit Perpetuals.
— Bybit (@Bybit_Official) October 13, 2023
Trade here: https://t.co/le4XyVyXaZ
Also want your project listed? Share your suggestions here:https://t.co/W7EWJVVNV5 https://t.co/XgXoL7g0rF