Wall Street Memes (WSM) Price Re-bases, Nurturing Rebounds
Estimated Reading Time: 3 minutes
Don’t invest unless you’re prepared to lose all the money you invest. This is a high-risk investment and you are unlikely to be protected if something goes wrong. Take 2 minutes to learn more

Wall Street Memes Price Prediction – May 5
A consistent pattern of declining price action has led to notable corrective trading cycles in the Wall Street Memes coin, countering the prevailing strength of the U.S. dollar in recent sessions, given that the base instrument re-bases, nurturing rebounds.
The sustained systemic bargaining activity within the paired instruments has exhibited a prolonged compression phase beneath the $0.001 threshold, underscoring the strategic accumulation by long-term participants positioning for a potential volatility breakout and momentum recovery, pending the materialization of any exogenous rebound catalysts.
WSM/USD Market
Key Levels
Resistance levels: $0.001, $0.0015, $0.002
Support levels: $0.0005, $0.0004, $0.0003
WSM/USD – 4-hour Chart
The WSM/USD medium-term chart demonstrates that the crypto-economic trade re-bases at a bottom, nurturing rebounds.
The stochastic oscillators are yet to find deepening their steps in the oversold region, with lighter options to sustain feeble lows and limited downward momentum confirmation signals. The trend lines of the Bollinger Bands indicators are positioned eastwardly in the zones that border within the $0.001 and $0.0005 values, indicating continued volatility compression behavior.
Does the WSM/USD candlestick pattern indicate buyers are losing interest?
The market activity in WSM/USD has been structured in a way that allows long-term investors to enter at a more favorable, lower price level, as the trade-economic point re-bases, nurturing rebounds.
For long-position traders, it would be a prudent and strategically sound approach to closely monitor when the oscillators begin to trend downward, nearing or entering the oversold zone, signaling a potential bullish divergence and a more favorable entry point. This behavior aligns with the accumulation phase, suggesting an optimal time for executing buy orders based on support level validation.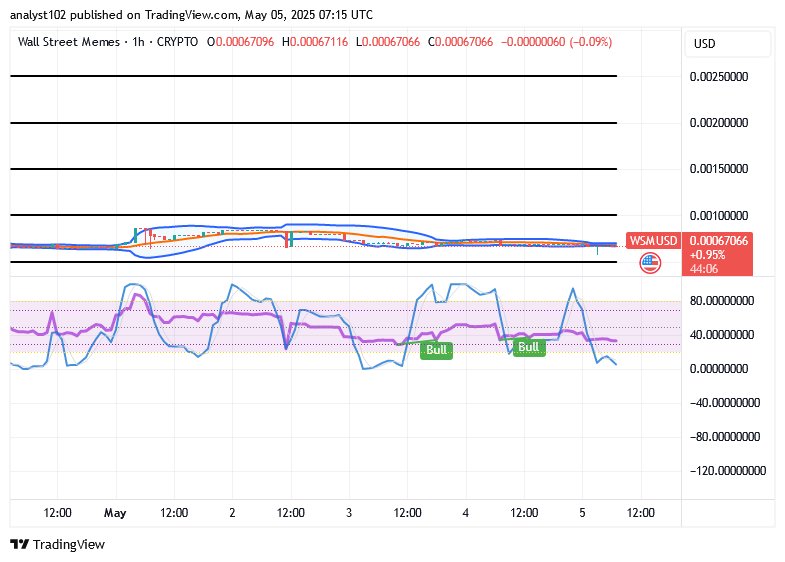
WSM/USD 1-hour chart
The 1-hour chart of WSM/USD shows that the short-term price action of the base cryptocurrency re-bases at a lower spot, nurturing rebounds.
It continues to show that the trend lines of the Bollinger Bands are poised to extend eastward, with the key levels remaining between $0.001 and $0.0005. Meanwhile, the stochastic oscillators are in the oversold region, hovering at the threshold of potential bullish signal formations.
$WSM injects meme power into the crypto space, supported by a large community and viral momentum. If memes and market momentum are key, $WSM could potentially shake up the markets.
$WSM (Wall Street Memes)$WSM brings meme power to the crypto world—backed by a massive community and viral energy. If memes and momentum matter, $WSM might just surprise the markets.#WSM #MemeCoin #CryptoCommunity #WallStreetMemes pic.twitter.com/LR75GqqJMQ
— FOLLOW ME GUYS 😎😎 (@khazin121) April 21, 2025