Wall Street Memes (WSM) Trade Rolls About, Showing Rises
Estimated Reading Time: 4 minutes
Don’t invest unless you’re prepared to lose all the money you invest. This is a high-risk investment and you are unlikely to be protected if something goes wrong. Take 2 minutes to learn more
Wall Street Memes Price Prediction – May 4
While some uncertainty remains in the tug-of-war between bullish and bearish sentiments, the consistent activity around the Wall Street Memes coin and the U.S. dollar valuation has offered a relatively strong foundation for strategic positioning, signaling cautious yet promising opportunities in the market, given that the crypto’s trade rolls about below $0.001, showing rises.
The market’s current positioning between the $0.001 and $0.008 range presents a promising opportunity for investors to establish positions ahead of the next potential upswing. With the WSM/USD pair maintaining a stable tone and yet to make aggressive rebounds in recent sessions, the setup favors proactive accumulation at attractive levels, reinforcing confidence in a likely forthcoming upward move.
WSM/USD Market
Key Levels
Resistance levels: $0.001, $0.0015, $0.002
Support levels: $0.0005, $0.0004, $0.0003
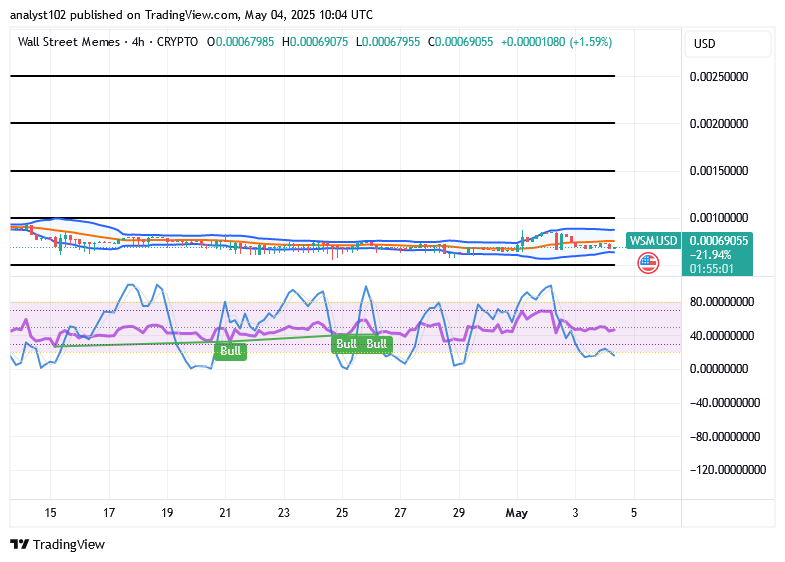
WSM/USD – 4-hour Chart
The medium-term chart of the WSM/USD trade, as of the time of this write-up, reveals that the crypto market rolls about underneath $0.001, showing rises.
The current configuration of the Bollinger Bands reveals an expanded volatility envelope, reflecting a broadening market range. Concurrently, the stochastic oscillators have descended into oversold territory, indicating a diminishing downside momentum. This convergence suggests a potential exhaustion of selling pressure and the emergence of conditions favorable for a cyclical re-entry of bullish activity.
Does the WSM/USD market risk further downside despite oscillators signaling a potential bullish threshold?
The oscillators continue to reinforce expectations of an upward move, suggesting that recent lower lows in the WSM/USD market are likely temporary and unlikely to persist in the broader long-term trend, which remains favorably positioned for recovery, given that the crypto-economic price rolls about below $0.001, showing rises.
The emerging candlestick structure within the Bollinger Bands framework reveals a sequence of lower highs, indicative of a potential accumulation phase. This formation suggests strategic positioning is underway, fostering an increasingly constructive outlook for a breakout above key resistance levels and supporting the prospect of sustained bullish continuation over the longer term.
WSM/USD 1-hour chart
The WSM/USD short-term market’s operation showcases that the crypto-economic price rolls about underneath the line of $0.001, showing rises.
The Bollinger Bands are converging tightly within a narrow horizontal range between the $0.001 and $0.0005 levels, signaling reduced volatility and a potential buildup in market pressure. Meanwhile, the stochastic oscillators display a brief downward drift, suggesting a temporary pause in momentum as bullish forces approach a phase of technical consolidation, potentially setting the stage for a renewed upward shoot-out.
In the past 24 hours, the $WSM token and its community were subjected to a coordinated cyberattack, with the primary focus being an intrusion into our Discord server.
Over the last 24 hours, The $WSM token and community has undergone a coordinated attack. The hackers specifically targeted our Discord community.
— Wall Street Memes (@wallstmemes) October 12, 2023
We reiterate that no one from the Wall St Memes team will ever direct message you first, or ask for any personal information – even… pic.twitter.com/VwySpXC7cz