Wall Street Memes (WSM) Price increases, Validating Rising Inputs
Estimated Reading Time: 3 minutes
Don’t invest unless you’re prepared to lose all the money you invest. This is a high-risk investment and you are unlikely to be protected if something goes wrong. Take 2 minutes to learn more

Wall Street Memes Price Prediction – May 2
The buying and selling activity for the Wall Street Memes coin, compared to the US dollar, has been positive, with market activity regularly hovering around the important price level of $0.002, as the crypto price increases, validating rising inputs.
In recent sessions, although the price has hovered near the upper Bollinger Band and approached the $0.001 resistance level, the market has experienced a series of downward corrections. This suggests that while recovery attempts are underway, they remain largely confined to the lower regions of key technical indicators. Given this mixed momentum and the potential for swift rebounds, traders should exercise caution before executing short positions, as premature shorting could expose them to unexpected upside volatility.
WSM/USD Market
Key Levels
Resistance levels: $0.0015, $0.002, $0.0025
Support levels: $0.0005, $0.0004, $0.0003
WSM/USD – 4-hour Chart
The medium-term chart of the WSM/USD trade showcases that the crypto’s market increases catalysts, validating rising inputs’ styles.
The stochastic oscillators are showing promising upward movement toward the overbought zone, signaling growing buyer strength and the potential onset of sustained bullish momentum. Supporting this outlook, candlestick patterns continue to reflect steady upward pressure, with the market price around $0.00077847 closely tracking the upper Bollinger Band — a sign of healthy bullish engagement
Will WSM/USD persist in trading below the $0.001 threshold over subsequent sessions?
The WSM/USD trade may continue ranging below or near the $0.001 resistance if buyers fail to exert decisive momentum for a swift and sustained breakout, as the trade line shows that market increases catalysts, validating rising inputs’ styles.
It has been slowly demonstrated that a constructive revelation tactic for fostering sustainable appreciation in the base crypto economy, particularly as the Bollinger Bands have remained slightly and steadily stretched northward—thereby bolstering confidence among risk-averse investors and seasoned chartists monitoring latent volatility and mean-reversion potential.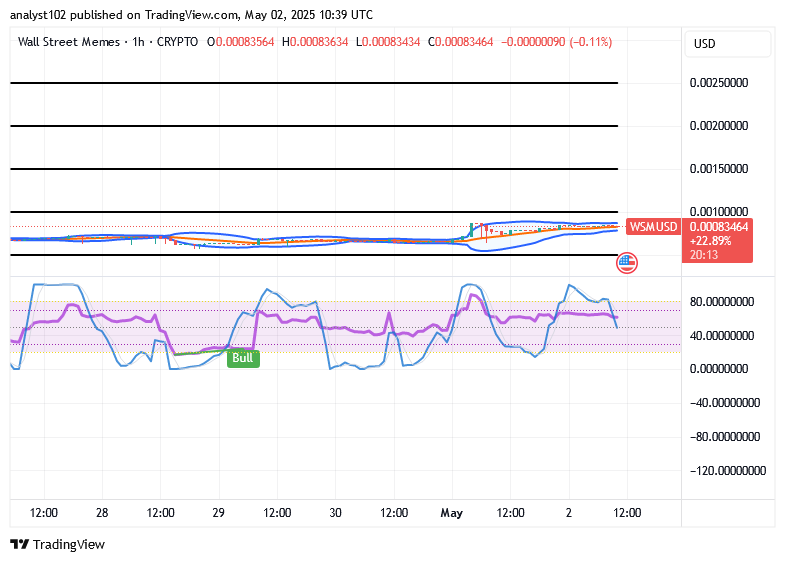
WSM/USD 1-hour chart
The WSM/USD short-term market’s operation showcases that the crypto-economic market increases in energy-garnering setup, validating rising inputs.
The stochastic oscillators exhibit a transient southern tilt, implying that bullish momentum is nearing a point of technical consolidation. Concurrently, the Bollinger Bands have commenced a moderate divergence, delineating expanded volatility corridors around the prevailing trend structure—an early signal of amplified price fluctuations in the near term.
The first $WSM Airdrop is finally LIVE and ready for claiming!
Your rewards are based on your verified on-chain activity, which can be transparently checked down below.
$WSM community, we saw your Tweets! 👏$WSM / $USDT is now tradeable on #Bybit Perpetuals.
— Bybit (@Bybit_Official) October 13, 2023
Trade here: https://t.co/le4XyVyXaZ
Also want your project listed? Share your suggestions here:https://t.co/W7EWJVVNV5 https://t.co/XgXoL7g0rF