Wall Street Memes (WSM) Market Is On, Making Tangible Rises
Estimated Reading Time: 3 minutes
Don’t invest unless you’re prepared to lose all the money you invest. This is a high-risk investment and you are unlikely to be protected if something goes wrong. Take 2 minutes to learn more
Wall Street Memes Price Prediction – May 1
Some pricing efforts have consistently generated to portend that buyers are on the pathway of pushing strongly against the WSM/USD market bears, as the crypto-economic market is seen being on, making tangible rises.
In the last couple of trading cycles, it has been technically demonstrated that most trade execution orders between the trade zones of $0.001 and $0.0005 are the most decent entries in the wake of anticipating rising forces to back up all the moves to the north in no time, especially as volume builds and momentum indicators begin aligning more favorably.
WSM/USD Market
Key Levels
Resistance levels: $0.002, $0.0025, $0.003
Support levels: $0.0008, $0.0006, $0.0004
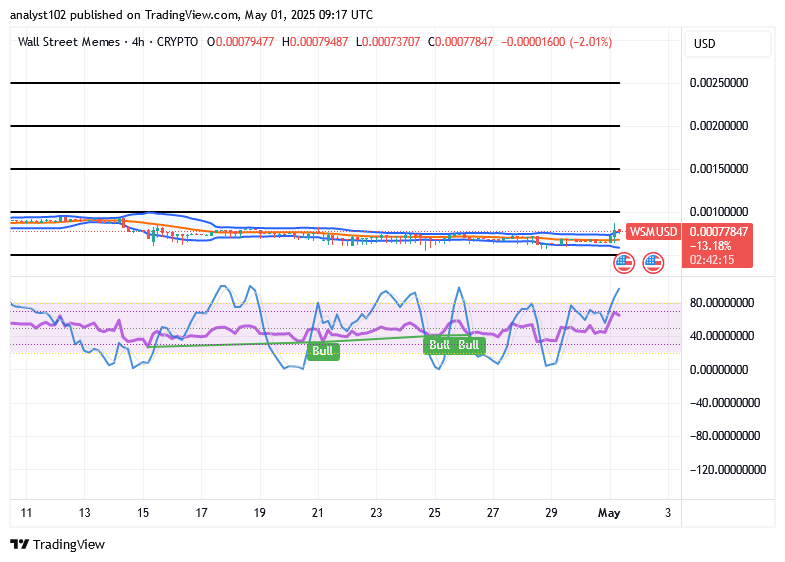
WSM/USD – 4-hour Chart
The medium-term chart of the WSM/USD trade showcases that the crypto-economic market is on, making tangible rises.
Candlesticks are exhibiting consistent upward momentum as the market currently trades around $0.00077847, closely aligning with the upper Bollinger Band. The stochastic oscillators are partially curling upward into the overbought zone, indicating that buyers are actively driving the emergence of sustained bullish cycles.
Will the WSM/USD market action persist in trading below the $0.001 threshold over the course of subsequent sessions?
There might be room for the ranging price systems to prevail underneath or around the resistances of the $0.001 if the WSM/USD trade purchasers remain not pouring ideal muscles to create a sudden and sustainable move across the line in no time, given that the crypto’s price is on a baseline building up, making tangible rises.
It is gradually becoming a good revealing tactic toward making sustainable increases in the valuation of the base crypto economy, especially since the Bollinger Bands indicators have remained not freely stretched further abruptly to the downside over a couple of sessions, reinforcing confidence among cautious investors and technical market observers.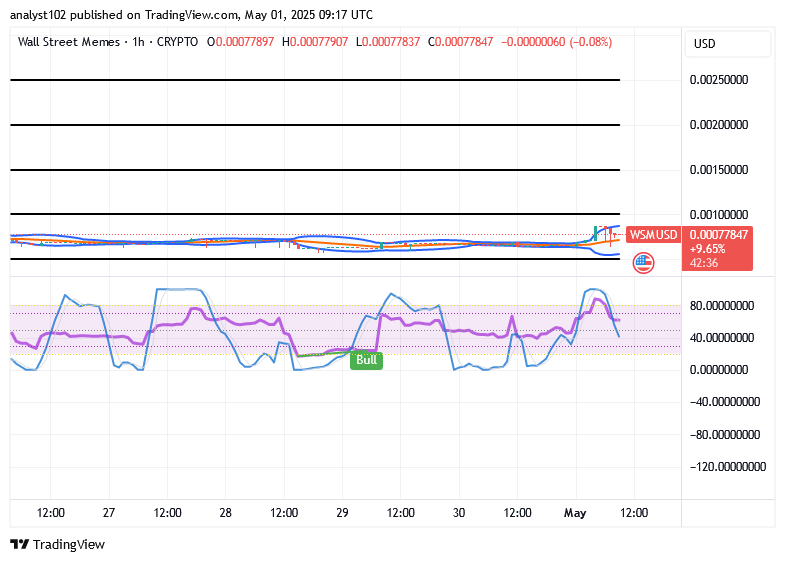
WSM/USD 1-hour chart
The 1-hour chart of the WSM/USD trade is in the short-term running style of the crypto trade, which is on a baseline building up, making tangible rises.
The Bollinger Bands indicators have gently opened to create considerably wider trade zones around the trend lines, suggesting increased market volatility ahead. The stochastic oscillators are briefly positioned southward to denote that buying pressures are on the threshold of holding a firmer technical basis.
BIGTIMEUSDT and WSMUSDT perpetual contracts are now live on Bybit!
🚀 BIGTIMEUSDT & WSMUSDT Contracts now on Bybit!
— Bybit (@Bybit_Official) October 12, 2023
Dive into new trading opportunities with 1-25x leverage. Plus, they’re now on Bybit Futures Grid Bot! Start trading now.
📈 BIGTIME: https://t.co/FAQlbhnzAh
📈 WSM: https://t.co/pb2y2AfMBE#CryptoTrading #Bybit