Bitcoin Cash (BCH/USD) Market Stays in a Descending Setting
Estimated Reading Time: 3 minutes
Don’t invest unless you’re prepared to lose all the money you invest. This is a high-risk investment and you are unlikely to be protected if something goes wrong. Take 2 minutes to learn more

Free Crypto Signals Channel
Bitcoin Cash Price Prediction – March 4
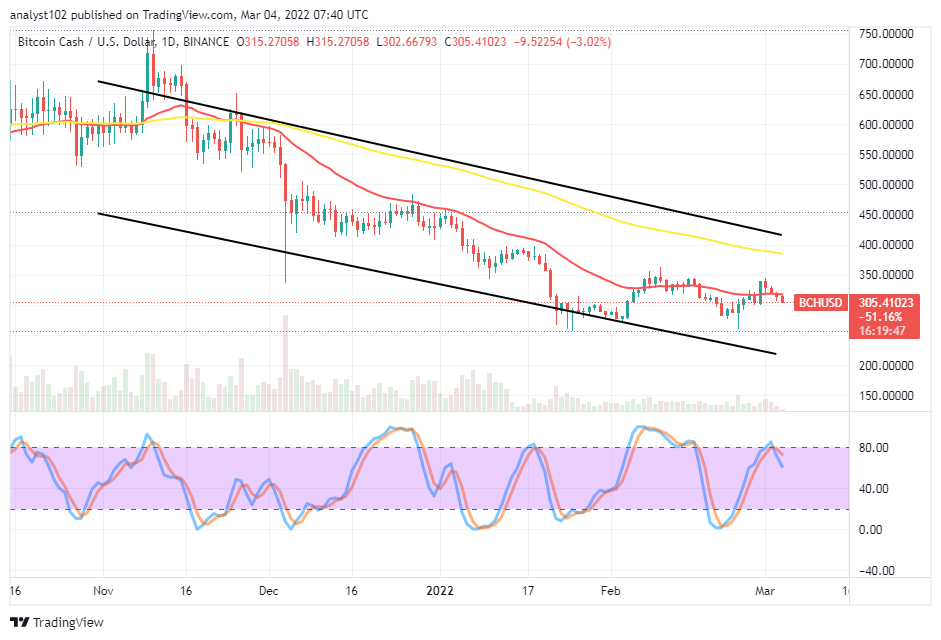
The apparent trading outlook of the BCH/USD trade shows the crypto-economic market stays in a descending setting as it trades around $305 presently. The crypto has witnessed a high and a low of $315 and $302 in that order at a negative percentage of 3.02.
BCH/USD Market
Key Levels:
Resistance levels: $350, $400, $450
Support levels: $250, $200, $150
BCH/USD – Daily Chart
The BCH/USD daily chart reveals the crypto-economic market stays in a descending setting as some of the bullish candlesticks formed close to the resistance of $350 about a couple of days back eventually turned out losing sustainability. There is a range of space separating the SMA trend lines as the 14-day SMA is underneath the 50-day SMA. The Stochastic Oscillators have crossed southbound against the range of 80. It shows that a downward force is in the offing.
Will there be aggressive forces to the downside 0f the BCH/USD price as the market stays in a descending setting?
It is not likely that there will be aggressive forces to the downside of the BCH/USD trade as the crypto-economic market stays in a descending setting. The springing of the crypto-economic price back to the upside may take a while. The previous lower support level of around $250 has to revisit for finding support before bulls can consider a re-launch of longing orders afterward.
On the downside of the technical analysis, the BCH/USD market short-position placers have to be their presence tightened against a sudden rebounding motion against the trend line of the 14-day SMA. A technical thought shows that a ranging movement is playing out around $350, $300, and $250. The range mid-point is about to breach southward in no time.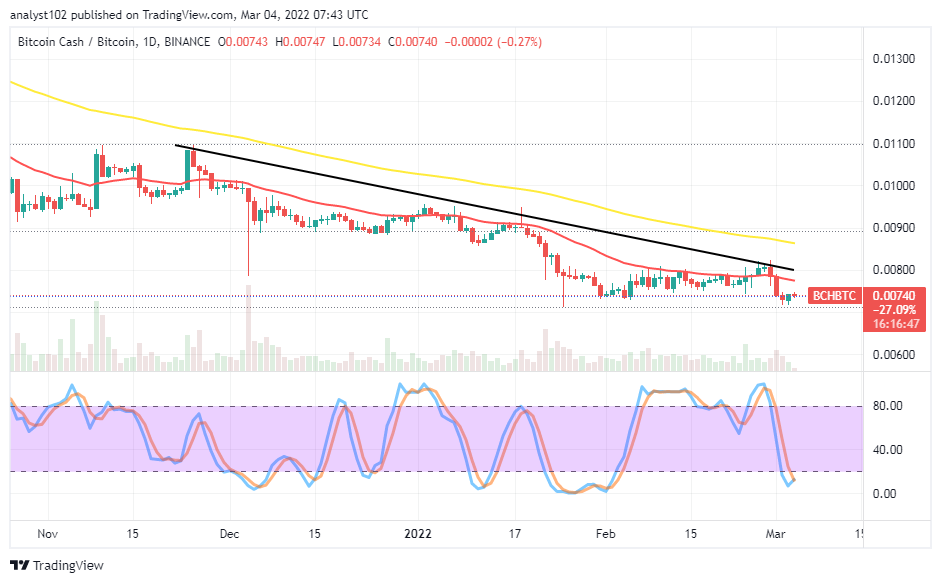
BCH/BTC Price Analysis
In comparison, Bitcoin Cash appears to have been tied down under a downing pressure arrangement as juxtaposed with Bitcoin on the price analysis chart. The current trending outlook showcases the cryptocurrency pair market stays in a descending setting over time until the present. The 14-day SMA indicator is underneath the 50-day SMA indicator. The Stochastic Oscillators are in the oversold region with their lines closed. That reading condition could in the near time give birth to seeing a ranging pattern of candlesticks emergence afterward. If that scenario plays out as presumed, it would be better for traders to stay away from trading for a while to let the market observe a definite direction to follow.
Note: Cryptosignals.org is not a financial advisor. Do your research before investing your funds in any financial asset or presented product or event. We are not responsible for your investing results.
You can purchase Lucky Block here. Buy LBlock: