BNB Remains Static As It Holds Above The 226 Low
Estimated Reading Time: 2 minutes
Don’t invest unless you’re prepared to lose all the money you invest. This is a high-risk investment and you are unlikely to be protected if something goes wrong. Take 2 minutes to learn more

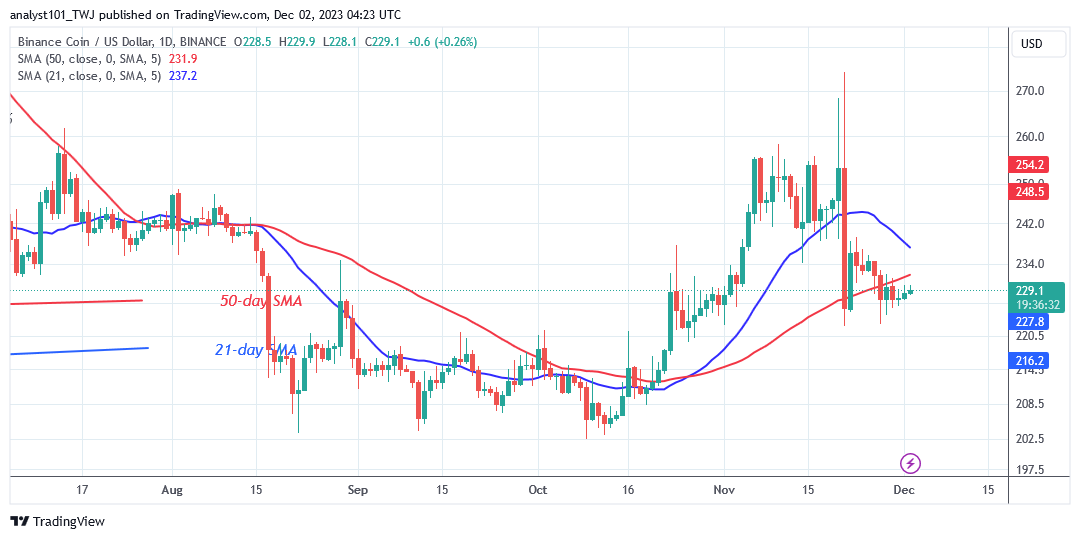
BNB (BNB) Long-Term Analysis: Ranging
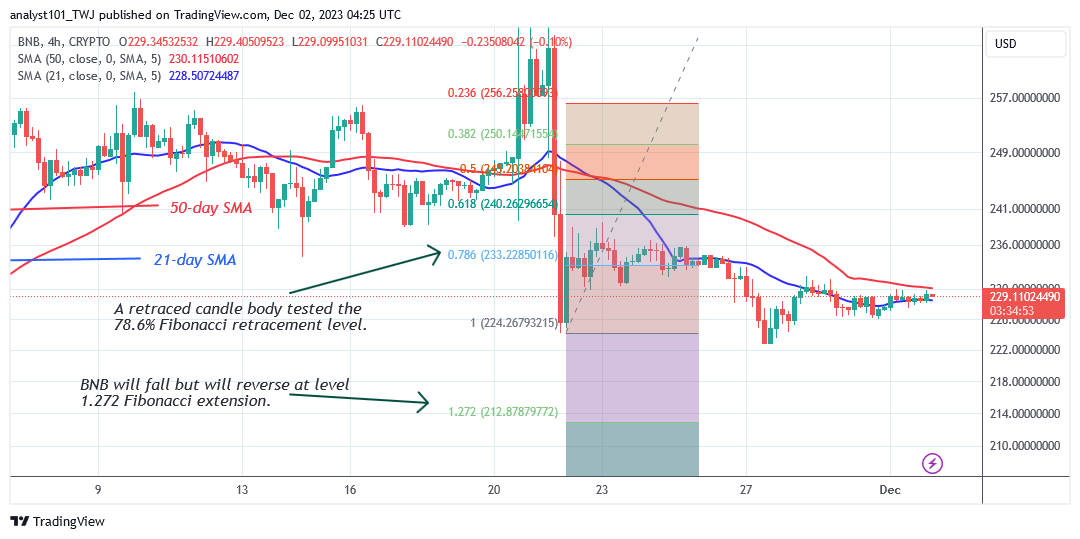
The price of BNB (BNB) resumes its sideways trend as it holds above the 226 low. The selling pressure has eased after hitting a low of $222. The altcoin is currently correcting upward as BNB achieves a high of $229.20. The upward trend is being met with resistance at the $230 high or the 50-day SMA. The rising movement is shaky due to the Doji candlesticks’ limitations.
On the downside, if the altcoin retraces and breaches the present support level of $222, the selling pressure will resume. BNB/USD will fall to a low of $203.
Technical indicators:
Major Resistance Levels – $440, $460, $480
Major Support Levels – $240, $220, $200
BNB (BNB) Indicator Analysis
Since November 21, the price bars have remained below the moving average lines as the coin rises. The price of BNB could decrease if the coin is rejected at the 50-day SMA. In general, Doji candlesticks have caused price movement to be static.
What Is the Next Direction for BNB (BNB)?
Binance Coin is currently trading in the bearish trend zone as it holds above the 226 low. Since November 29, the rising trend has been met with resistance at the high of $230. There is a tendency for the coin to move even more negatively. On the negative, BNB will first fall to a low of $222 before reaching another low of $212.
You can purchase crypto coins here. Buy LBLOCK
Note: Cryptosignals.org is not a financial advisor. Do your research before investing your funds in any financial asset or presented product or event. We are not responsible for your investing results