Chainlink (LINK/USDT) at the Crossroads: Can the Bulls Reclaim the Trend?
Estimated Reading Time: 3 minutes
Don’t invest unless you’re prepared to lose all the money you invest. This is a high-risk investment and you are unlikely to be protected if something goes wrong. Take 2 minutes to learn more

Chainlink Long-term Analysis: Ranging
The market for Chainlink against the Tether after periods that seem to explain months of bearish dominance has approached a crucial turning point as the price hovers around $12.00, suggesting a potentially weakened momentum.
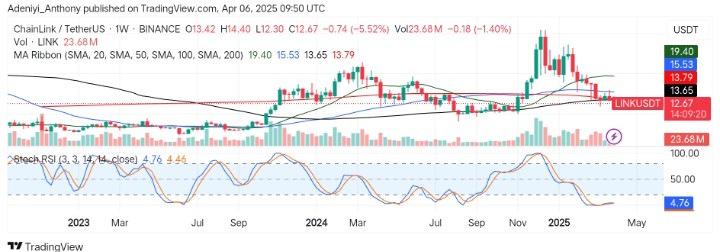
Recently, Chainlink was one of the top performers in the market, but after facing rejection at $20.00, it is now testing key support between the $12.00 and $13.00 regions. As it stands, the indicators on the weekly timeframe indicate the price is at a critical juncture. However, the question remains whether the bulls can reclaim the trend.
Currently, Chainlink trades at $12.67, with a moderate 23.68 million traded volumes for the week.
Technical Indicators
Major Resistance Levels: $13.65, $14.00, and $15.53
Major Support Levels: $12.00, $11.00, and $9.40
Chainlink Technical Analysis
Following the dip below $20.00, Chainlink against the Tether on a weekly chart has been in a corrective downtrend, slipping below key moving averages and indicating intensifying selling pressure. However, the positioning of the 200-SMA offers the possible rebound setup, as it approaches a potential demand zone.
On the other hand, the Stochastic RSI signals an oversold condition with signs of potential reversal on the horizon, provided the bulls can act fast.
To this end, a hold above the 200-SMA line with an increasing volume would give the bulls a chance above $13.65; otherwise, a continuation of the current trend would lead to the creation of further lows.
LINK/USDT Analysis: What’s Happening Here?
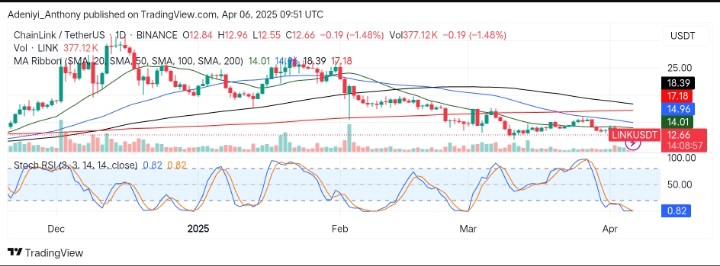
On the daily timeframe, LINK/USDT remains under key moving averages, moving to the south, showing the hesitation of the bulls. However, the price continues to compress below a descending structure, forming a possible falling wedge if the buyers can confirm it.
The Stochastic oscillator, on the other hand, signals a slight fall from the previous position. However, the oversold condition indicates the pair might see a short-term increase soon.
To this end, a reclaim of the $13.20 zone could spark an upside movement; otherwise, a break below the $12.20 would suggest a further fall.
You can purchase crypto coins here. Buy LBlock