ChainLink (LINK/USDT) Eyes Potential Bullish Rebound
Estimated Reading Time: 3 minutes
Don’t invest unless you’re prepared to lose all the money you invest. This is a high-risk investment and you are unlikely to be protected if something goes wrong. Take 2 minutes to learn more

ChainLink Long-term Analysis: Ranging
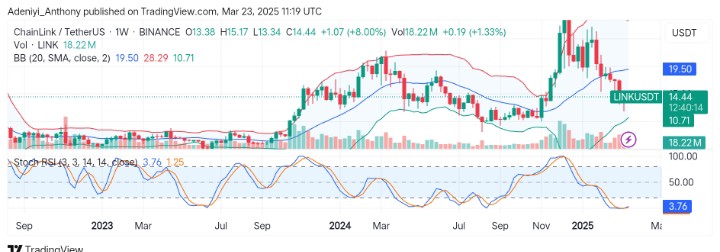
The market transactions for ChainLink against the Tether crypto pair have been such that they have favored the bears for an extended period. The pair’s price has gone down as far as $12.10 in recent trading sessions after hitting above the $30.00 all-time high.
Recently, there have been some noticeable upticks in the price, which still ranges between $10.71 and $14.00. However, with increasing volume, bullish participants are optimistic about breaking above the mid-line at $19.50 as the momentum oscillator signals more improvement ahead.
Currently, ChainLink trades at $14.44, with over 18 million weekly traded volumes and recording a gain of about 8%.
Technical Indicators
Major Resistance Levels: $15.50, $19.50, and $28.29
Major Support Levels: $12.00, $10.71, and $9.00
ChainLink Technical Analysis
The analysis of ChainLink against the Tether on a weekly timeframe shows that the pair is prepared for a bullish rebound in the near term. However, the price activities within the lower Bollinger bands show the improvement is still new and lacks strong conviction.
On the other hand, the Stochastic RSI signals more improvement awaits the pair as the lines point to the north.
To this end, a move above $15.50 would indicate the start of a northbound journey; otherwise, the price may range at the current level.
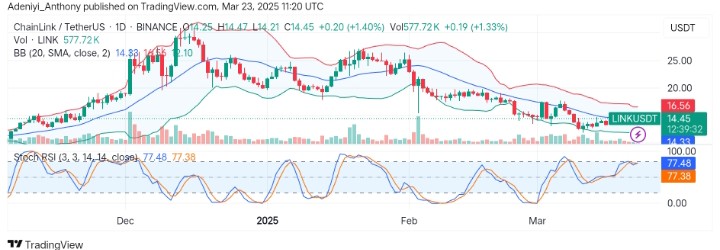
LINK/USDT Analysis: What’s Happening Here?
On the daily chart, LINK/USDT has seen a moderate influx of bullish participants. This is seen in the price movement above the $14.33 mid-line as the pair projects towards the $16.56 upper limit.
However, the oscillator beneath the chart shows LINK/USDT is beginning to near exhaustion as the lines move deep into the overbought region. This suggests a pullback might occur soon before a potential continuation of the uptrend.
To this end, the price needs to maintain a position above the mid-line level for an uptrend; otherwise, a dip below $14.00 would indicate a resumption of the previous trend.
You can purchase crypto coins here. Buy LBlock