ChainLink (LINK/USDT) Makes Plan for an Upside Movement
Estimated Reading Time: 3 minutes
Don’t invest unless you’re prepared to lose all the money you invest. This is a high-risk investment and you are unlikely to be protected if something goes wrong. Take 2 minutes to learn more

ChainLink Long-term Analysis: Ranging
From the beginning of the year, the market for ChainLink against the Tether has witnessed a significant price drop. The price of the pair fell from around $20.00, the new year high, to the current level.
Recently, the pair’s price actions show that ChainLink is prepared for a move to the North. However, for this to materialize, the price must break above the $17.00 resistance level.
Despite the expansion of the Bollinger bands, the Stochastic RSI has yet to display a bullish crossover. However, ChainLink trades at $14.10, with a 2.17% gain already.
Technical Indicators
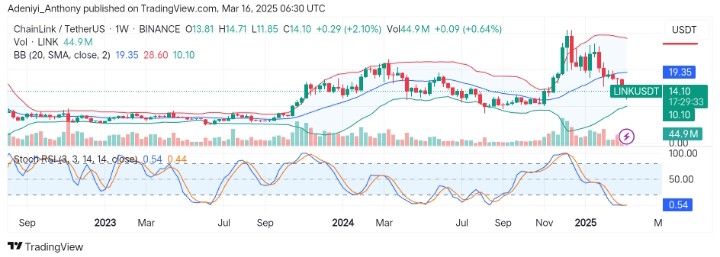
Major Resistance Levels: $17.27, $19.35, and $28.60
Major Support Levels: $12.18, $10.10, and $5.00
ChainLink Technical Analysis
The analysis for ChainLink against the Tether on a weekly timeframe shows that the pair is beginning to move to the North as the price sees a positive gain after opening at $13.81 for the week. The Bollinger bands seem to expand, but the price action below the mid-band at $19.35 shows the current move lacks strong conviction.
On the other hand, the Stochastic oscillator indicates a ranging signal as both lines lie on each other in the highly oversold region.
To this end, the price must break above the immediate resistance levels for a confirmed move upward; otherwise, these gains may be overridden if bearish momentum is rekindled.
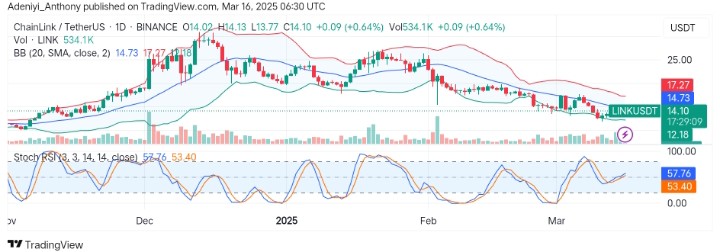
LINK/USDT Analysis: Is the Rebound Possible?
On the daily timeframe, LINK/USDT keeps getting fueled by bullish strength; the pair opened at $14.02 but is now at $14.10. The Bollinger bands indicate LINK is oversold. However, the price actions suggest the bullish traders seem ready to go against the tides.
On the other hand, the Stochastic RSI signals a neutral condition with the lines pointing up. This suggests LINK/USDT has room to improve to the north in the short term. However, the $14.73 resistance must be broken; otherwise, a fall in price below $12.78 would suggest a re-entry of the bearish traders.
You can purchase crypto coins here. Buy LBlock