Polkadot (DOT/USDT) Bulls Eyeing New Highs Amid Strengthening Momentum
Estimated Reading Time: 3 minutes
Don’t invest unless you’re prepared to lose all the money you invest. This is a high-risk investment and you are unlikely to be protected if something goes wrong. Take 2 minutes to learn more
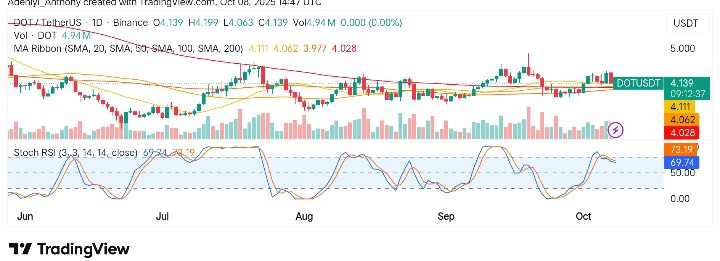
As seen on the chart below, the Polkadot against Tether pair is currently experiencing bullish momentum. Recently, price action has shown an upward trajectory, breaking above key resistance levels.
However, the Stochastic RSI indicator is also giving a bullish signal, with the blue line approaching overbought territory, reinforcing the potential for further price action to the upside as well as the possibility of a decline.
Currently, Polkadot trades at $4.139, recording more than 4.94 million traded volumes for the day.
Technical Indicators
Major Resistance Levels: $4.228, $4.330, and $5.000
Major Support Levels: $4.028, $3.977, and $3.862
Technical Analysis
Technically, Polkadot against Tether on the daily timeframe has been in a mild bullish structure, despite the recent fall in the price level. The pair has been aiming at building a base above the support level for a move to the north.
Meanwhile, despite the fundamentals around the market, the pair is still finding strength to hold above the $4.000 level above the moving average ribbons. This shows the pair may be setting the stage for a move to the north as trading volume increases.
However, the only clog in the wheel is that the Stochastic RSI, which measures momentum, appears to be suggesting a slight decline as the price seems to be overbought.
Should Polkadot maintain a position above the current support, more gains will be recorded. To this end, a move towards $5.000 depends on how well bullish traders are able to sustain momentum.
$DOT \ Polkadot 🔃
Polkadot has been accumulating for a long time in both USD and $BTC pairs and is gathering strength above the demand zone.
With the RSI supporting this movement, DOT is preparing for a new upward phase. The sleeping giant, which has been quiet for a long… pic.twitter.com/pUEl1Jh4B7
— EᴛʜᴇʀNᴀꜱʏᴏɴᴀL 💹🧲 (@EtherNasyonaL) October 7, 2025
Meanwhile, @Ethernasyonal’s view on Polkadot appears to be one that shows the token is currently accumulating both in USD and BTC, gathering strength to stay above the demand zone.
The analyst opines that Polkadot might be preparing for an upside phase since it looks like the RSI appears to be supporting the current move on the shorter timeframe.
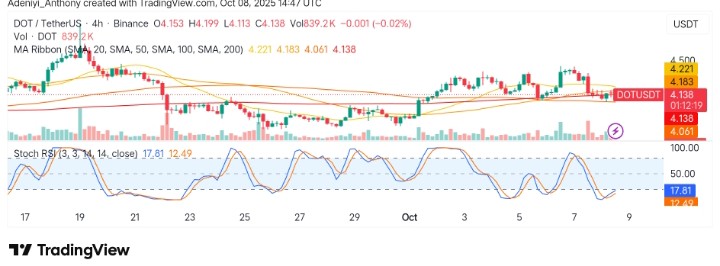
DOT/USDT Analysis: Key Support at Risk
On the 4-hour chart, DOT/USDT shows a consolidation phase, with the price hovering below key resistance at $4.221. At the moment, recent price action suggests a downward pressure, with the price currently testing lower support levels around $4.130.
However, the Stochastic RSI is deeply oversold, indicating that a reversal could occur soon if buying momentum picks up. Until then, the market remains in a bearish posture, with the support at $4.130 acting as a critical level to watch.
You can purchase crypto coins here. Buy Crypto