Polkadot (DOT/USDT) Eyes Bullish Momentum as Price Holds Key Support
Estimated Reading Time: 3 minutes
Don’t invest unless you’re prepared to lose all the money you invest. This is a high-risk investment and you are unlikely to be protected if something goes wrong. Take 2 minutes to learn more
The market for Polkadot against Tether has recently shown a mixed sentiment across different timeframes. The price has been fluctuating within a range, as seen in the recent price action, which appears to be a consolidation phase before making a potential move. However, with the current pullback, it is critical to monitor whether DOT will manage to hold its support levels or face downside pressure.
At the moment, the stochastic RSI is approaching overbought levels, signaling that a potential pullback could occur. To this end, if the price breaks through resistance, we may see further upside; otherwise, the pair may need to go into a corrective phase.
Currently, Polkadot trades at $4.220 with over 2 million traded volumes for the day.
Technical Indicators
Major Resistance Levels: $4.329, $4.450, and $4.600
Major Support Levels: $4.200, $4.120, and $4.034
Polkadot Technical Analysis
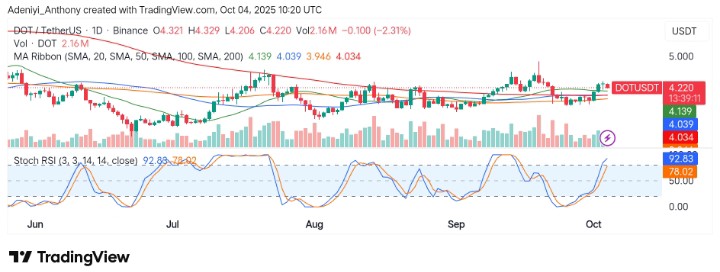
Technically, the price action reveals that Polkadot against Tether is attempting to break above resistance, but sellers have been active around the $4.300 level.
As of now, the pair’s value appears to be facing difficulties in ascending, forming a range between key support at $4.200 and resistance at $4.329. To this end, if DOT continues to face rejection at this level, coupled with the overbought condition of the Stochastic RSI, the risk of a pullback increases.
Polkadot Golden Cross Confirmed
Polkadot appears to be showing a lot of strength, holding above a strong support at $4.200. However, the price needs to break above the next ceiling for things to get interesting. As a matter of fact, the $6.280 is the biggest area of traded volumes in years, and it appears the coin can make it to such a level again if higher highs and lows keep reoccurring, but now the market is positive.
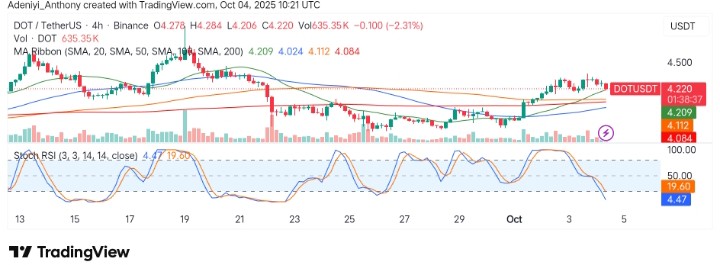
DOT/USDT Analysis: Facing Short-term Reversal Risk Amid Overbought Condition
On the 4-hour chart, DOT/USDT appears to be encountering pressure after a strong upward move. Also, the Stochastic RSI seems to be heading deep into the oversold territory (19.60), indicating a potential short-term reversal or pullback.
Meanwhile, the price got rejected around $4.284 recently, aligning with a key resistance area near the 100-day.
Now, the price is at $4.220, hovering near support levels, with a cautious outlook unless it can regain bullish momentum. However, the volume has also shown a decline, further signaling a possible weakening of upward pressure.
To this end, if the price falls below $4.200, we could see DOT testing lower support zones, with $4.120 and $4.084 as key levels to watch. Conversely, a reclaim above $4.284 could bring the token back toward higher resistance levels in the near term.
You can purchase crypto coins here. Buy Crypto