Polkadot (DOT/USDT) Surge Towards Key Resistance Despite Low Market Momentum
Estimated Reading Time: 3 minutes
Don’t invest unless you’re prepared to lose all the money you invest. This is a high-risk investment and you are unlikely to be protected if something goes wrong. Take 2 minutes to learn more
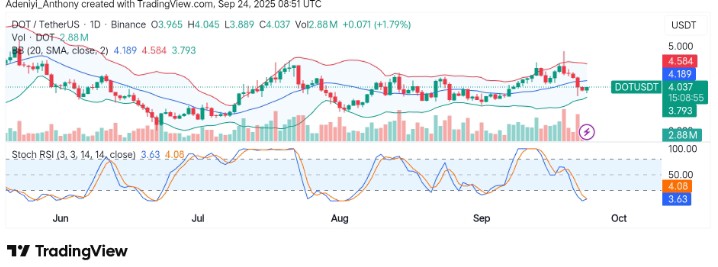
Polkadot against Tether has seen a slight recovery after facing strong resistance around $4.500 in the previous session. The pair has been able to maintain a value above $4.000 despite facing sell pressure owing to the optimistic views of the bullish participants.
Recently, the pair seems to be aiming big, turning at the $4.189 resistance level as the Stochastic RSI signals a bullish crossover is on the horizon. However, the Bollinger Bands appear to be indifferent to these market changes, as the indicator extends to the east with almost proportional distance between its lines.
Currently, Polkadot trades at $4.037, recording over 2.8 million (+1.79) traded volumes for the day.
Technical Indicators
Major Resistance Levels: $4.189, $4.500, and $5.000
Major Support Levels: $4.000, $3.890, and $3.790
Polkadot Technical Analysis
Technically, it appears Polkadot against Tether is gearing up for a bullish run, as indicated by the momentum oscillator placed beneath the chart. However, fundamentals have it that the pair mirrors Bitcoin’s (-0.39%) and Ethereum’s (-0.53%) dip, suggesting that the pair lacks enough propelling force to move to the north at the moment, as the resistance around $4.10 still stands.
To this end, the stagnation in the market for Polkadot reflects technical resistance and the expectation of promising tokenomics in the near term.
$DOT: I assume wave B has formed a price top in the orange scenario. A test of support is likely.
It remains a messy chart! pic.twitter.com/JnjhGNsuH3— More Crypto Online (@Morecryptoonl) September 21, 2025
Moreover, @Morecryptoonline has assumed a B-wave formation in the orange scenario. The analyst believes a test of immediate support may be likely before a move to the north. However, the issue of stagnancy on the chart persists.
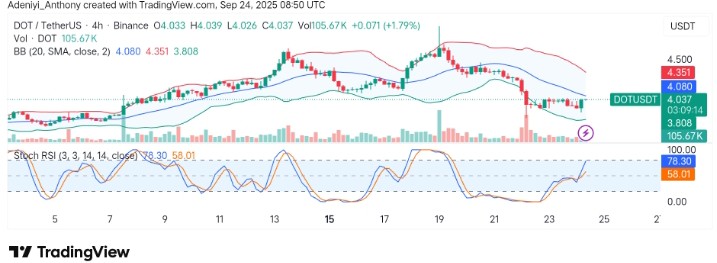
DOT/USDT Analysis: Short-term Consolidation or Retracement?
On the 4H chart, DOT/USDT seems to be exhibiting a bullish momentum, driving near the $4.080 dynamic resistance level. However, the appearance of the Stochastic’s blue in the overbought zone suggests a possible pullback or consolidation is near.
The bullish participation in this timeframe appears to be healthy, as the price is beginning to gain traction. However, the 78-mark position of the momentum oscillator signals a pullback might be near, as caution is warranted.
To this end, Polkadot could continue its bullish journey through $4.350 in the coming session, provided the $4.080 resistance is broken with an increasing volume; otherwise, the price needs to correct even lower than $4.000.
You can purchase crypto coins here. Buy Crypto