Solana (SOL) Price Prediction: SOL/USDT Crosses a Key Marks
Estimated Reading Time: 3 minutes
Don’t invest unless you’re prepared to lose all the money you invest. This is a high-risk investment and you are unlikely to be protected if something goes wrong. Take 2 minutes to learn more
Solana (SOL) Price Prediction: August 23
The SOL/USDT market has continued to trade within the price range of $185 and $123.27. Today’s session has pushed the market past some key indicator levels. Technically, these have the potential to quickly propel the market towards higher marks.
SOL/USDT Long-term Trend: Bullish (Daily Chart)
Key Price Levels:
Resistance: $150, $160, $170
Support: $140, $130, $120
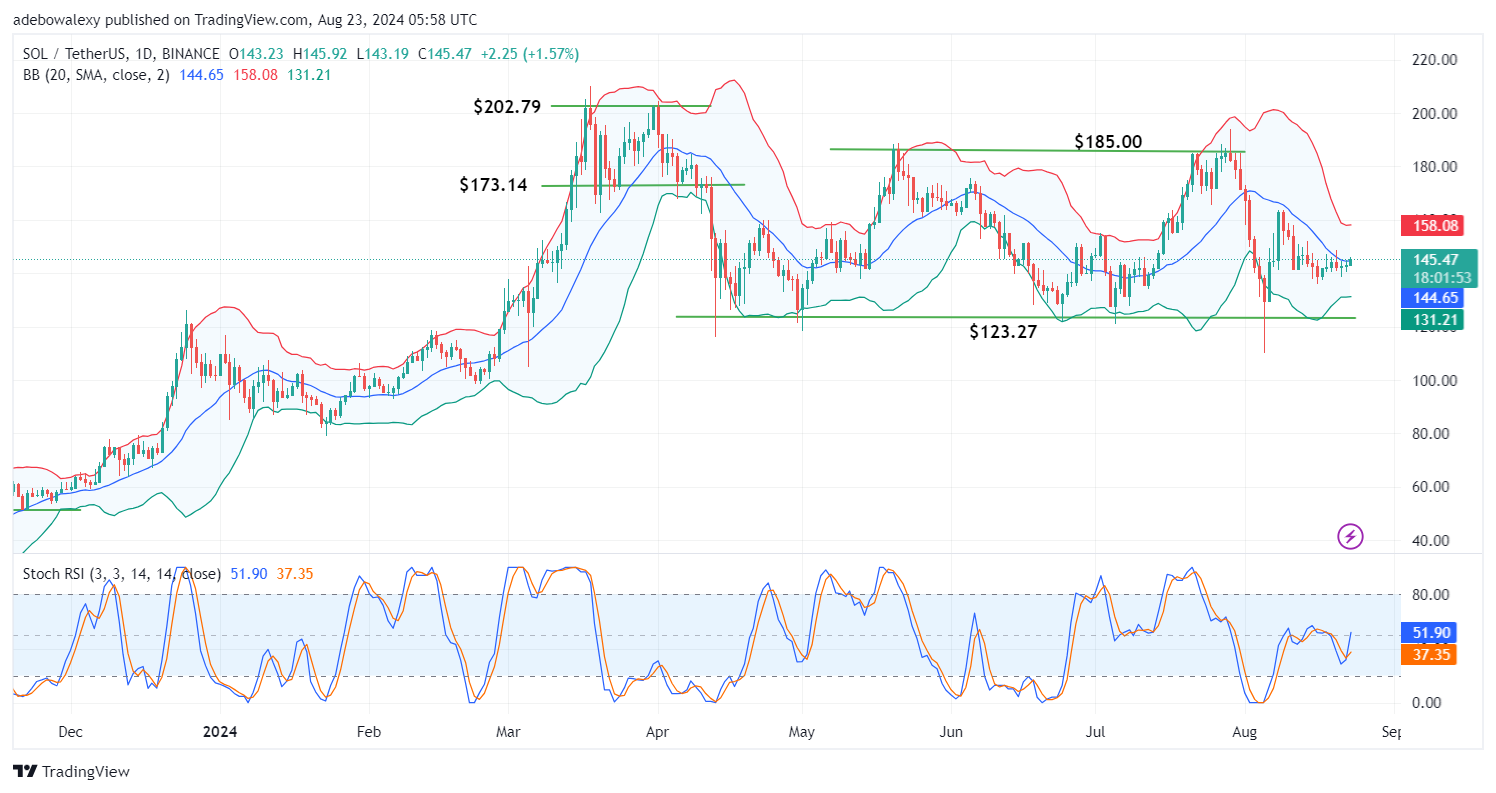
The last price candle on the Solana daily market has placed the price of the token above the middle limit of the Bollinger Bands (BB) indicator. Additionally, the direction of the BB indicator itself has shifted from a downward trend to a sideways one. The Stochastic Relative Strength Index (Stochastic RSI) indicator has delivered a bullish crossover below the 50 mark, and its lines are now rising steeply.
Solana (SOL) Price Prediction: SOL/USDT Price Action Pops Through a Promising Mark
The SOL/USDT market has indeed popped its way through a promising mark on the BB indicator. The last price candle on the chart can be seen with its close already above the middle limit of the BB indicator. Meanwhile, the distance between the upper and lower limits of the indicator seems fairly wide, suggesting further upward price movement.
Additionally, the Stochastic RSI indicator has already delivered a bullish crossover, and its lines are now steeply rising. This suggests that price action could rise further as bullish momentum builds from here on out.
Solana (SOL) Price Prediction: SOL/USDT Eyes the $150 Price Level (4-Hour Chart)
In the 4-hour Solana market, price activity continues to occur above the middle limit of the BB indicator. However, volatility still appears minimal, and the BB indicator seems contracted. Nonetheless, the Stochastic RSI curves have already risen deep into the overbought region.
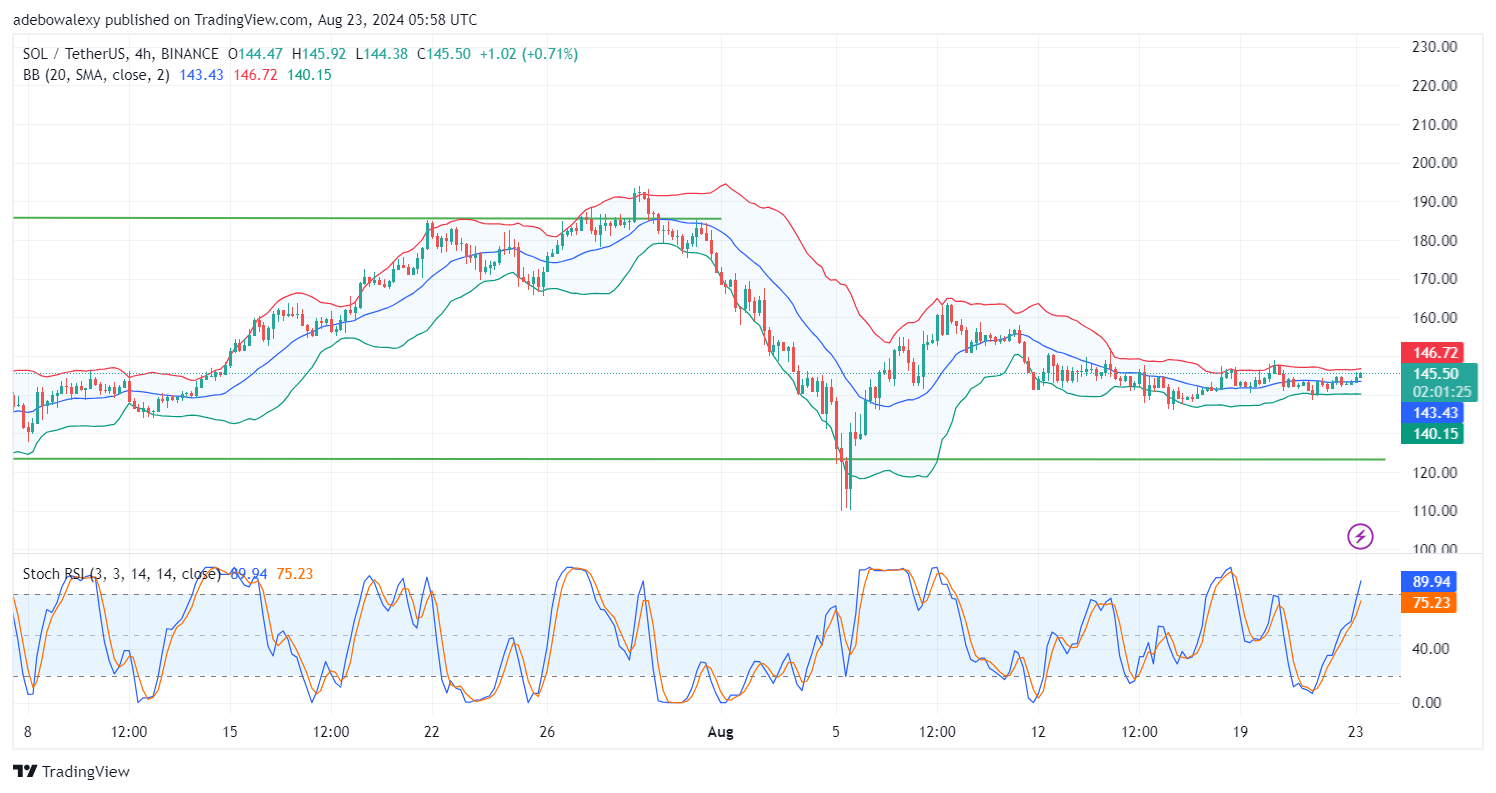
While the movement of the Stochastic RSI seems exaggerated, the contraction of the BB indicator might also suggest an impending spike in volatility. Nevertheless, traders in this market should ensure that they set their trades carefully to stay on the safer side. Be that as it may, price action may hit the $150 mark in subsequent sessions.