Chainlink Makes Positive Moves but Faces Rejection at $8 High
Don’t invest unless you’re prepared to lose all the money you invest. This is a high-risk investment and you are unlikely to be protected if something goes wrong. Take 2 minutes to learn more

Free Crypto Signals Channel
Chainlink (LINK) Long-Term Analysis: Ranging
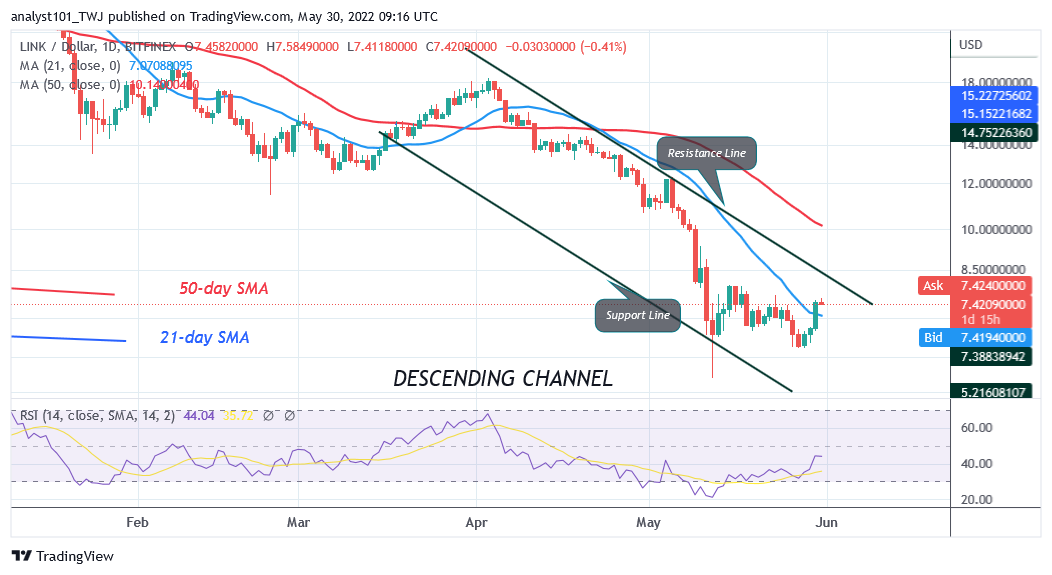
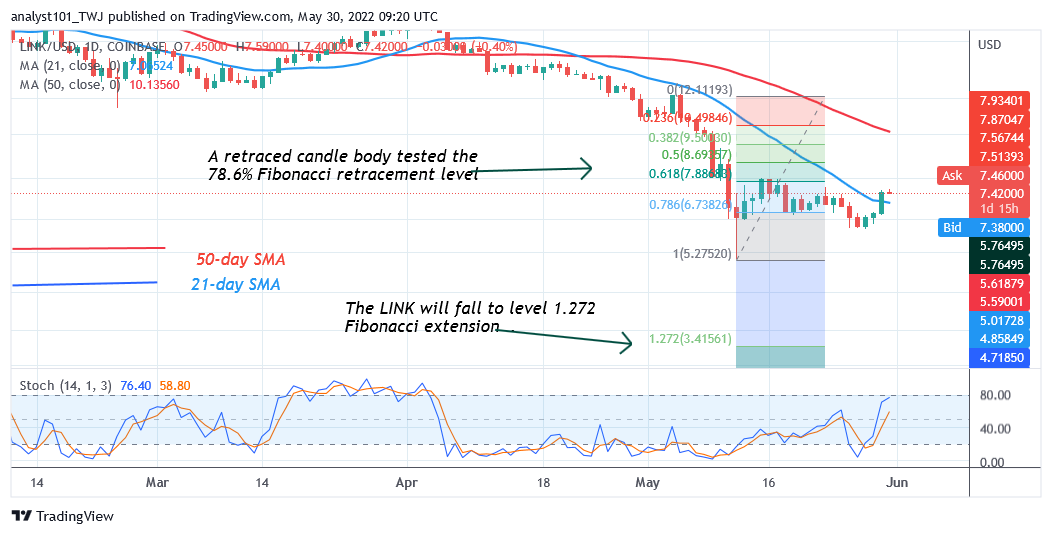
Chainlink’s (LINK) price holds above the current support but faces rejection at $8 high. The bulls failed to keep the bullish momentum above the $8 high. On the upside, if the bulls break above the resistance at $8, the market will rally to the 50-day line SMA. The upside momentum will resume if the bulls break above the 50-day line SMA. In the meantime, Chainlink is falling as it reaches the overbought region of the market.
Chainlink (LINK) Indicator Analysis
Chainlink is at level 44 of the Relative Strength Index for period 14. The altcoin is in the downtrend zone despite the upward correction. Chainlink is above the 70% range of the daily stochastic. It indicates that the market is in a bullish momentum. The 21-day line and the 50-day line SMAs are sloping southward indicating the downtrend.
Technical indicators:
Major Resistance Levels – $20.00, $22.00, $24.00
Major Support Levels – $12.00, $10.00, $8.00
What Is the Next Direction for Chainlink (LINK)?
Chainlink is making an upward move but faces rejection at $8 high. The coin is retracing to the downside. The uptrend will resume if it falls and finds support above the 21-day line moving average. On the other hand, the selling pressure will resume if price breaks below the 21-day line SMA and the current support.
You can purchase crypto coins here. Buy LBlock
Note: Cryptosignals.org is not a financial advisor. Do your research before investing your funds in any financial asset or presented product or event. We are not responsible for your investing results