Chainlink Fluctuates in a Tight Range as Bulls Attempt a Rally above $8
Estimated Reading Time: 2 minutes
Don’t invest unless you’re prepared to lose all the money you invest. This is a high-risk investment and you are unlikely to be protected if something goes wrong. Take 2 minutes to learn more

Free Crypto Signals Channel
Chainlink (LINK) Long-Term Analysis: Ranging
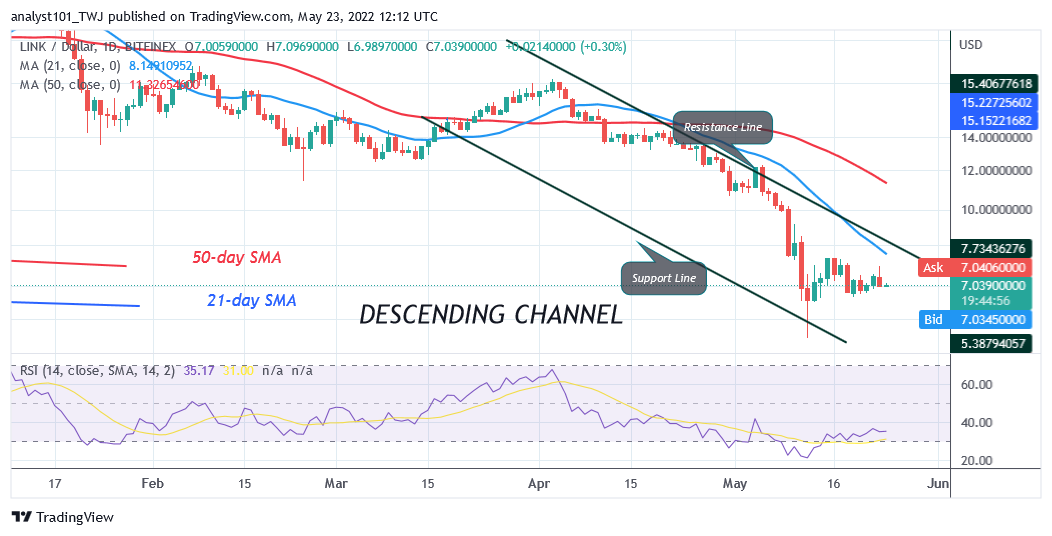
Chainlink’s (LINK) price has resumed a sideways move as it attempt a rally above $8. The sideways trend is characterized by small body indecisive candlesticks called Doji. Chainlink is fluctuating in a tight range between $5.50 and $8.00 price levels. On the upside, if the altcoin rebounds, the LINK price will rally above the $8 resistance zone. The market will rise to the high of $12. A break above the moving averages will signal the resumption of the uptrend. On the downside, the bulls are likely to defend the current support as the coin was earlier oversold.
Chainlink (LINK) Indicator Analysis
Because of the recent upward correction, Chainlink is at level 35 of the Relative Strength Index for period 14. Buyers have emerged to push the coin upward. Chainlink is above the 40% range of the daily stochastic. It indicates that the market is in a bullish momentum. The 21-day line and the 50-day line SMAs are sloping southward indicating the downtrend.
Technical indicators:
Major Resistance Levels – $20.00, $22.00, $24.00
Major Support Levels – $12.00, $10.00, $8.00
What Is the Next Direction for Chainlink (LINK)?
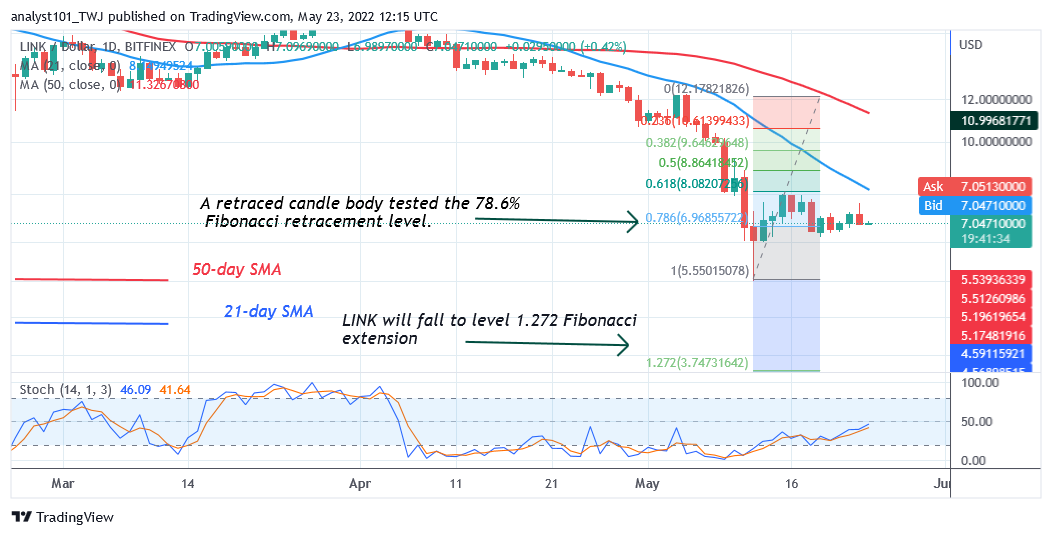
Chainlink has continued to fluctuate in a tight range as it attempt a rally above $8. Meanwhile, on May 12 downtrend; a retraced candle body tested the 78.6% Fibonacci retracement level. The retracement indicates that LINK will fall to level 1.272 Fibonacci extension or $3.74. From the price action, Chainlink is holding above the $5.50 support.
You can purchase crypto coins here. Buy LBlock
Note: Cryptosignals.org is not a financial advisor. Do your research before investing your funds in any financial asset or presented product or event. We are not responsible for your investing results