BNB Is in a Range but Faces Resistance at $600
Estimated Reading Time: 2 minutes
Don’t invest unless you’re prepared to lose all the money you invest. This is a high-risk investment and you are unlikely to be protected if something goes wrong. Take 2 minutes to learn more

BNB (BNB) Long-Term Analysis: Bullish
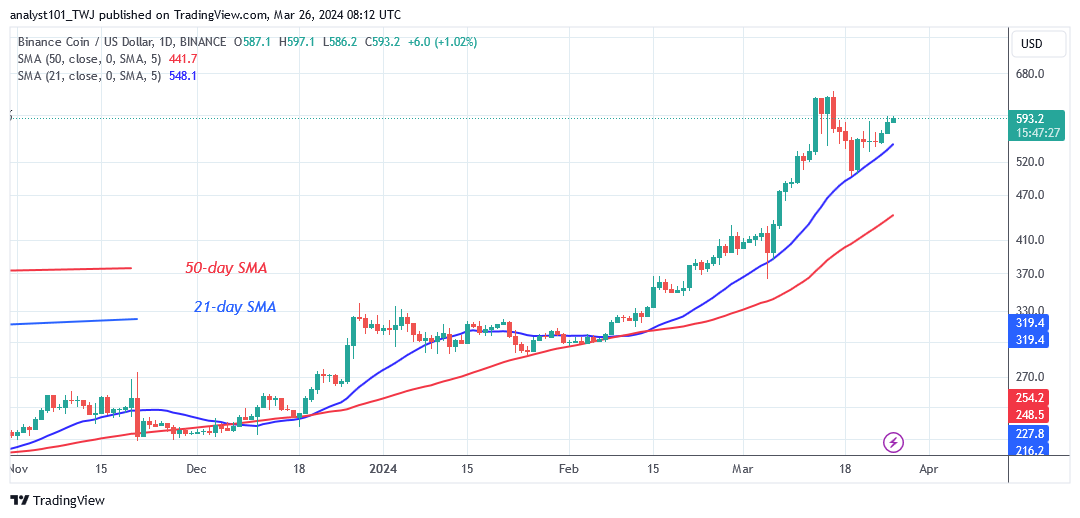
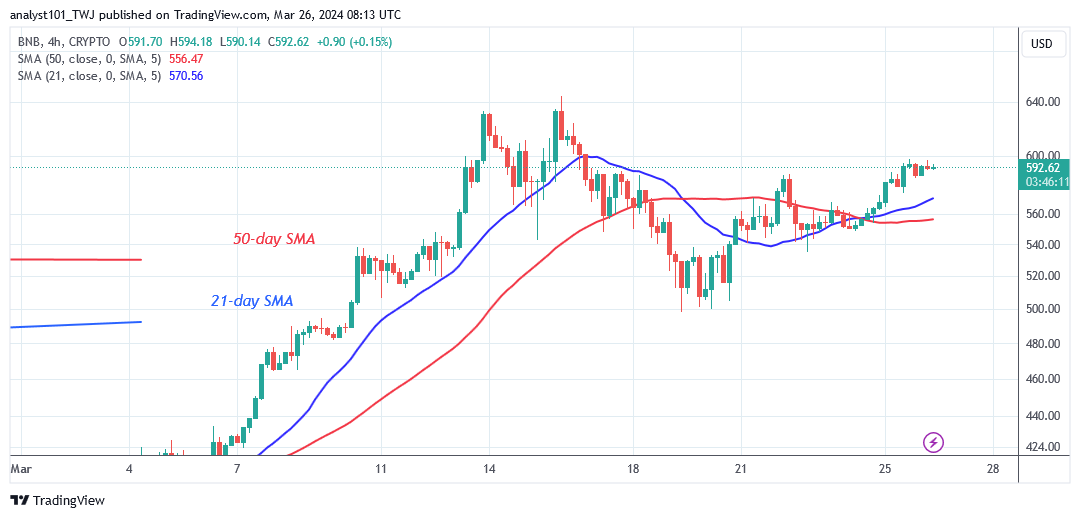
BNB’s price has continued its upward trend but faces resistance at $600. On March 13, BNB surged to a high of $645 but was met with resistance. The cryptocurrency asset has retraced above the 21-day SMA or $498 support, commencing a range-bound move. The cryptocurrency’s price is rising, preparing to retest the resistance at $645.
On the upside, BNB will rise above the $700 overhead resistance if buyers sustain the price above the current level. The cryptocurrency will start trading in the bull market above the overhead resistance. Nonetheless, if the bullish scenario is rejected, BNB will be forced to trade sideways above the moving average lines but below the recent high. BNB/USD is currently worth $594.20.
Technical indicators:
Major Resistance Levels – $600, $660, $720
Major Support Levels – $400, $340, $280
BNB (BNB) Indicator Analysis
The price bars are above the moving average lines, indicating a current uptrend. The 21-day SMA has served as a support line, accelerating the altcoin’s upward trend. If the support line is breached, the altcoin’s price will fall. The moving average lines on the 4-hour chart are horizontal due to the sideways trend.
What Is the Next Direction for BNB (BNB)?
On the 4-hour chart, BNB is in a sideways trend but faces resistance at $600. The altcoin is now trading in a range of $500 to $640. The cryptocurrency price retested the resistance twice before resuming its horizontal trend. The crypto signal has been range-bound, with the altcoin facing more rejection at its $600 high.
You can purchase Lucky Block here. Buy LBLOCK
Note: Cryptosignals.org is not a financial advisor. Do your research before investing your funds in any financial asset or presented product or event. We are not responsible for your investing results