BNB Rises Above $490 and Moves Closer to the Prior Peak
Estimated Reading Time: 2 minutes
Don’t invest unless you’re prepared to lose all the money you invest. This is a high-risk investment and you are unlikely to be protected if something goes wrong. Take 2 minutes to learn more

BNB (BNB) Long-Term Analysis: Bullish
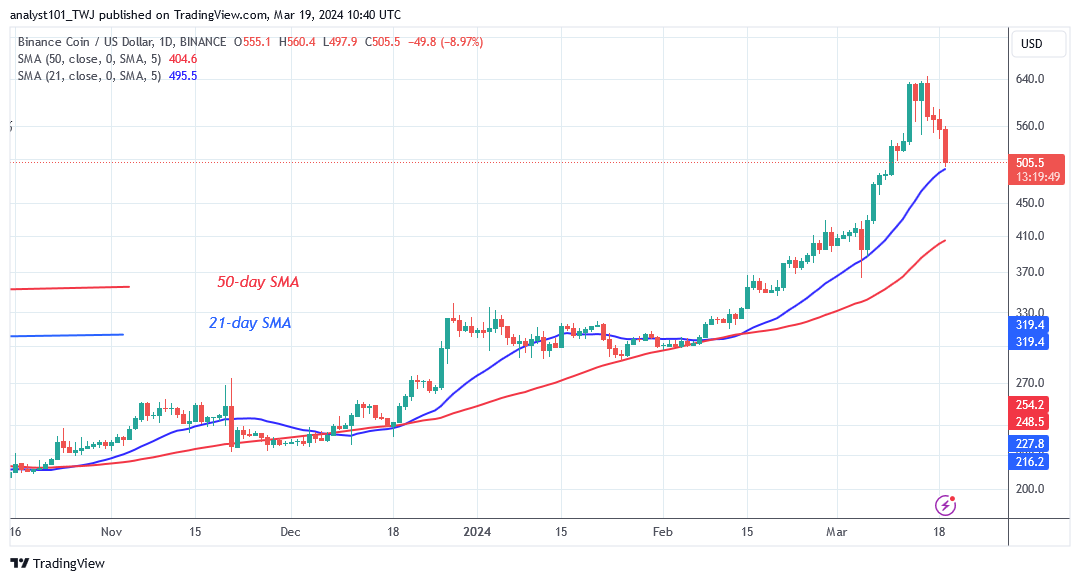
BNB’s price is recovering as it moves closer to the prior peak. Since March 13, bulls have been frantically trying to keep the bullish trend above the $640 high. On the upside, if the bulls succeed, BNB will break above the $700 overhead resistance. Nonetheless, BNB has retraced above the 21-day SMA, or a low of $497.
Since the altcoin surpassed the moving average line, selling pressure has subsided. BNB will resume its upward trend if the 21-day SMA support holds. The cryptocurrency asset will soar to its prior high of $640 and then surpass $700. However, if the 21-day SMA is broken, BNB will drop to a low above the 50-day SMA, or $405. BNB is now valued at $516.10 as of this writing.
Technical indicators:
Major Resistance Levels – $600, $660, $720
Major Support Levels – $400, $340, $280
BNB (BNB) Indicator Analysis
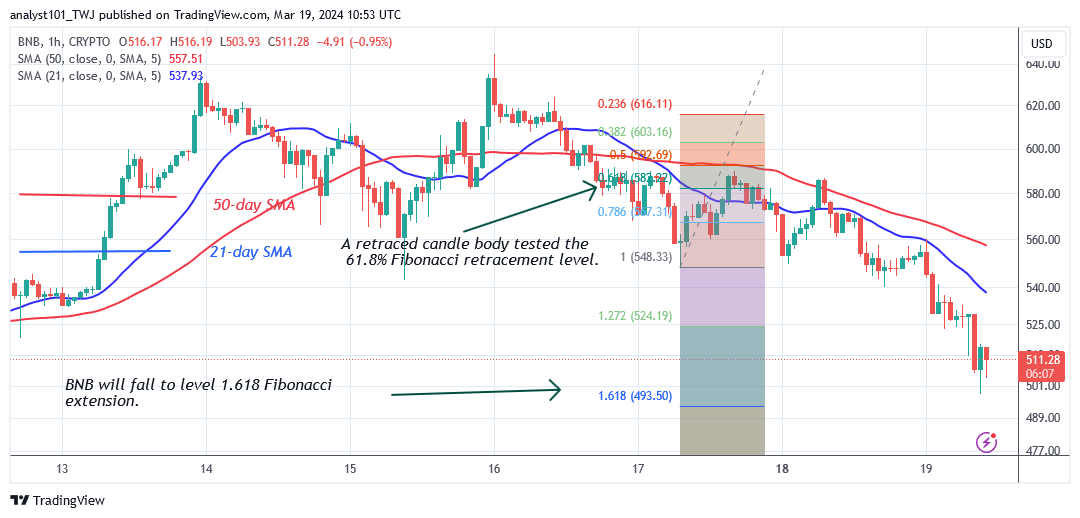
BNB prices rebound after retracing above the 21-day SMA support. The altcoin’s price will grow if it stays above the 21-day SMA. On the 4-hour chart, the cryptocurrency price has dropped below the moving average lines. The altcoin is in a bearish crossover, with the 21-day SMA crossing below the 50-day SMA.
What Is the Next Direction for BNB (BNB)?
BNB’s bearish trend has eased as it moves closer to the prior peak. The altcoin dropped to its prior low of March 11, 2024. On March 11, BNB reversed upward after staying above the $506 support level. The coin rose to $640. Today’s price indications suggest that BNB will fall to the 1.618 Fibonacci extension, or $493.50. The crypto signal will be positive if the current support holds.
You can purchase Lucky Block here. Buy LBLOCK
Note: Cryptosignals.org is not a financial advisor. Do your research before investing your funds in any financial asset or presented product or event. We are not responsible for your investing results