BNB Hits the $540 High and Begins a Sideways Slide
Estimated Reading Time: 2 minutes
Don’t invest unless you’re prepared to lose all the money you invest. This is a high-risk investment and you are unlikely to be protected if something goes wrong. Take 2 minutes to learn more

BNB (BNB) Long-Term Analysis: Bullish
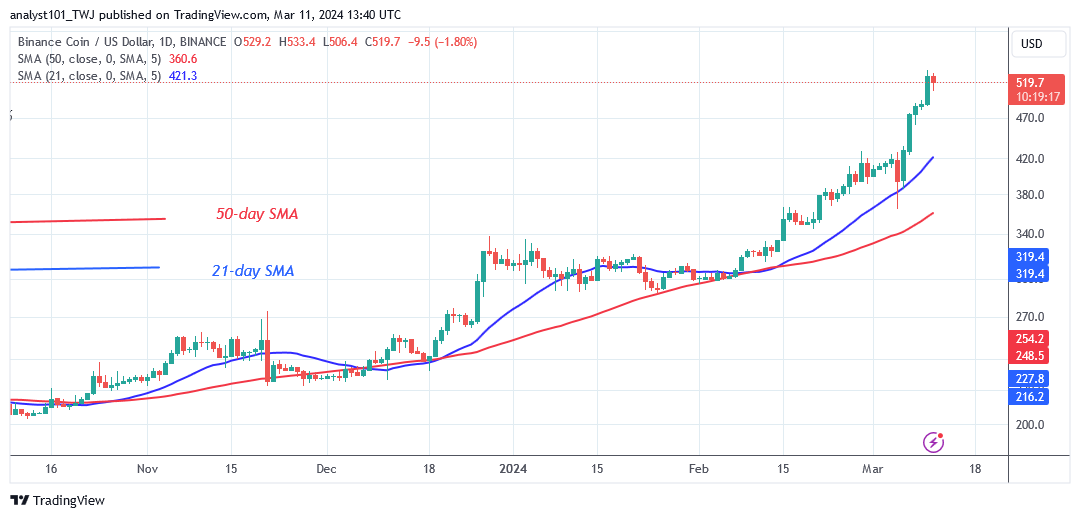
BNB’s price breaks above the resistance at $460 and begins a sideways slide. The crypto asset has continued to grow, reaching a high of $538. However, purchasers were unable to extend their bullish momentum above the $540 high. The latest high has stymied further upward movement of the cryptocurrency. BNB will surge to $600 if buyers surpass the latest high.
In contrast, the altcoin will trade above the moving average lines but below the recent high, where resistance remains unbroken. BNB is valued at $525.59 as of this writing.
Technical indicators:
Major Resistance Levels – $440, $460, $480
Major Support Levels – $240, $220, $200
BNB (BNB) Indicator Analysis
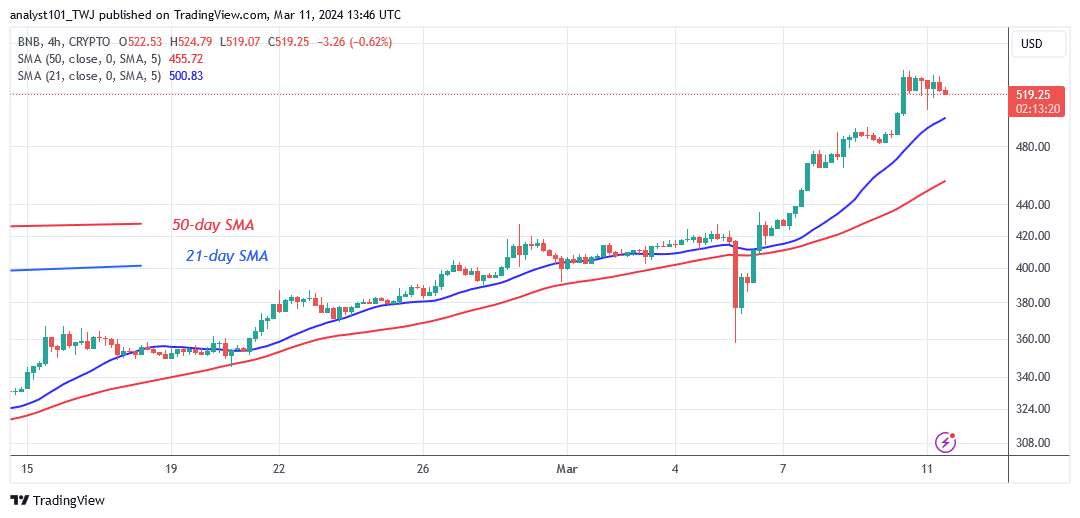
The price bars are above the moving average lines, which slope northward. On the 4-hour chart, the price bars are near the 21-day SMA but below the $540 resistance level. Altcoin risks fall if the 21-day SMA is reached. The altcoin is trading in the overbought area of the market.
What Is the Next Direction for BNB (BNB)?
BNB has hit bullish exhaustion as it begins a sideways slide. The altcoin is trading in a close range between $500, the 21-day SMA support, and $540, the resistance level. As the altcoin trades in a narrow range, it is at risk of declining or breaking out. Currently, the crypto signal is favorable as the altcoin continues its upward ascent.
You can purchase Lucky Block here. Buy LBLOCK
Note: Cryptosignals.org is not a financial advisor. Do your research before investing your funds in any financial asset or presented product or event. We are not responsible for your investing results