Ripple Rebounds above $0.31 Support but Is Stuck at $0.34 High
Estimated Reading Time: 2 minutes
Don’t invest unless you’re prepared to lose all the money you invest. This is a high-risk investment and you are unlikely to be protected if something goes wrong. Take 2 minutes to learn more

Free Crypto Signals Channel
Ripple (XRP) Long-Term Analysis: Bearish
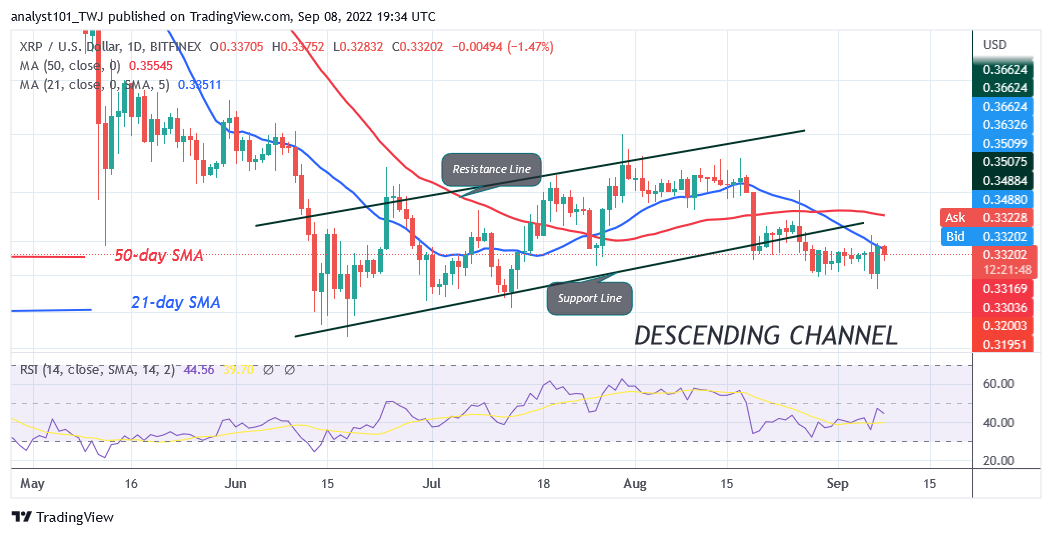
Ripple’s (XRP) price is still in a downtrend but is stuck at $0.34 high. On September 6, sellers breached the $0.32 support but the altcoin pulled back to the range-bound zone. On the downside, XRP will decline if the bears break the $0.32 support and the bearish momentum is sustained. Conversely, if buyers breach the $0.34 resistance, the altcoin will rally above the moving averages lines. The bullish momentum will extend to the $0.39 overhead resistance. In the meantime, XRP has retraced above the $0.33 support.
Ripple (XRP) Indicator Analysis
Ripple is at level 47 of the Relative Strength Index for period 14. XRP is in the downtrend zone as it approaches the bullish trend zone. XRP’s price is below the moving average lines which suggests a further decline. The altcoin is above the 25% range of the daily stochastic.XRP has been in a bullish momentum. The moving average lines are sloping southward indicating the downtrend.
Technical indicators:
Major Resistance Levels – $0.80, $1.00, $1.20
Major Support Levels – $0.60, $0.40, $0.20
What Is the Next Direction for Ripple (XRP)?
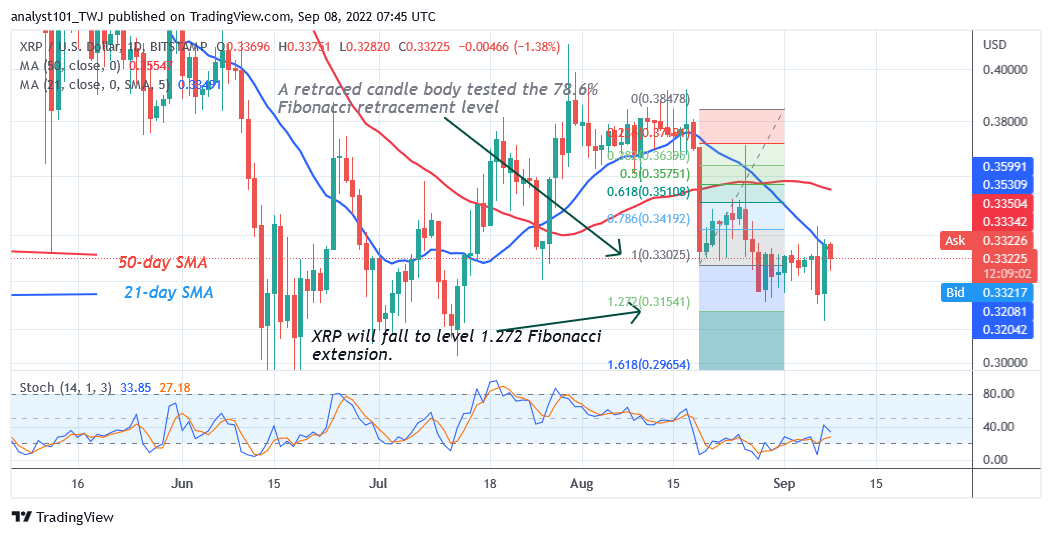
Ripple is trading in a confined range but is stuck at $0.34 high Yesterday, XRP declined to a low of $0.31 but the bulls bought the dips. Meanwhile, on the August 19 downtrend; a retraced candle body tested the 78.6% Fibonacci retracement level. The retracement suggests that XRP will fall to level 1.272 Fibonacci extension or $0.31.
You can purchase crypto coins here. Buy LBLOCK
Read also: Ripple and SEC May Settle Soon, Court Orders
Note: Cryptosignals.org is not a 1a financial advisor. Do your research before investing your funds in any financial asset or presented product or event. We are not responsible for your investing results